Climategate in Review
|
|
||||||||||||||
Climategate in Review
|
|
||||||||||||||
The real impact of the Climategate scandal was to cause people across the globe to finally begin to examine all of the information used by the United Nations' Intergovernmental Panel on Climate Change (IPCC) in support of its assessment report, used by every government to back up its environmental policies. Let's examine the results of this investigations.
| Description | Date | Sources | |||||||||||||||||||||||||||||||||||||||||||||||||||||||||||||||||||
|---|---|---|---|---|---|---|---|---|---|---|---|---|---|---|---|---|---|---|---|---|---|---|---|---|---|---|---|---|---|---|---|---|---|---|---|---|---|---|---|---|---|---|---|---|---|---|---|---|---|---|---|---|---|---|---|---|---|---|---|---|---|---|---|---|---|---|---|---|---|
|
All AGW computer models predicted a steady increase in global temperatures. However, for the past 11+ years, the global temperatures have not increased, and in fact, decreased, despite a continuing rise in CO₂, countering the theory of a causal connection between increasing carbon dioxide and rising temperatures. |
10-13-09 | BBC | |||||||||||||||||||||||||||||||||||||||||||||||||||||||||||||||||||
|
A close group of climate scientists (Phil Jones, Michael Mann, Keith Briffa, Malcolm Hughes, Robert Bradley, Tim Osborn, et al) "peer-reviewed" one another's papers, insuring that only those which supported the view of Anthropogenic Global Warming (AGW) as an imminent worldwide danger, would make it through their process. Quoting Phil Jones: "I can't see either of these papers being in the next IPCC report. Kevin and I will keep them out somehow - even if we have to redefine what the peer-review literature is!" |
11-19-09 11-23-09 |
East Anglia Email UK Telegraph |
|||||||||||||||||||||||||||||||||||||||||||||||||||||||||||||||||||
|
Scientific journals which published climate research were either headed up by "true believers", or else pressure was applied by the AGW scientists to insure that dissenting opinions were never published. Non-compliant journals were harassed and "punished". "The Soon & Baliunas paper couldn't have cleared a 'legitimate' peer review process anywhere. That leaves only one possibility--that the peer-review process at Climate Research has been hijacked by a few skeptics on the editorial board." "I told Mike that I believed our only choice was to ignore this paper. They've already achieved what they wanted--the claim of a peer-reviewed paper. There is nothing we can do about that now, but the last thing we want to do is bring attention to this paper, which will be ignored by the community on the whole..." "This was the danger of always criticising the skeptics for not publishing in the 'peer-reviewed literature'." "I think we have to stop considering 'Climate Research' as a legitimate peer-reviewed journal. Perhaps we should encourage our colleagues in the climate research community to no longer submit to, or cite papers in, this journal. We would also need to consider what we tell or request of our more reasonable colleagues who currently sit on the editorial board..." "I will be emailing the journal to tell them I'm having nothing more to do with it until they rid themselves of this troublesome editor." |
11-19-09 | East Anglia Email | |||||||||||||||||||||||||||||||||||||||||||||||||||||||||||||||||||
|
The East Anglia basic historical climate data used to forecast future climate trends was heavily manipulated to "produce" the desired results. "I really wish I could be more positive about the Kyrgyzstan material, but I swear I pulled every trick out of my sleeve trying to milk something out of that. ... I don't think it'd be productive to try and juggle the chronology statistics any more than I already have" "So, if we show Keith's series in this plot, we have to comment that 'something else' is responsible for the discrepancies in this case. Perhaps Keith can help us out a bit by explaining the processing that went into the series and the potential factors that might lead to it being 'warmer' than the Jones et al and Mann et al series?? We would need to put in a few words in this regard. Otherwise, the skeptics have an field day casting doubt on our ability to understand the factors that influence these estimates" "Indeed, if the non-temperature signal that causes the decline in tree-ring density begins before 1960, then a short 1931-60 period might yield a more biased result than using a longer 1881-1960 period." |
11-19-09 |
East Anglia Email East Anglia Email East Anglia Email |
|||||||||||||||||||||||||||||||||||||||||||||||||||||||||||||||||||
|
The code for the computer climate models was freely manipulated in order to force the desired results. Despite their best efforts, the programmers could never get these programs to run properly, occasionally producing nonsensical results. And the data sets used by these programs were clearly in a hopeless state. Here are samples of some of the code comments left by the programmers: "stop in 1960 to avoid the decline" "stop in 1940 to avoid the decline" "but why does the sum-of-squares parameter OpTotSq go negative?!!" "and already I have that familiar Twilight Zone sensation." "this renders the station counts totally meaningless." "Oh yeah - there is no 'supposed', I can make it up. So I have :-)" "As we can see, even I'm cocking it up!" "yet another problem that's based on the hopeless state of our databases" "recent decline in tree-ring density has been ARTIFICIALLY REMOVED" "Apply a VERY ARTIFICAL correction for decline!!" "artificially removed (i.e. corrected) the decline" "we know the file starts at yr 440, but we want nothing till 1400" "It's botch after botch after botch." "Oh, GOD, if I could start this project again and actually argue the case for junking the inherited program suite." "As far as I can see, this renders the [weather] station counts totally meaningless." "So what's going on? I don't see how the 'final' precip file can have been produced from the 'final' precipitation database, even though the dates imply that. The obvious conclusion is that the precip file must have been produced before 23 Dec 2003, and then redated (to match others?) in Jan 04." "You can't imagine what this has cost me -- to actually allow the operator to assign false WMO [World Meteorological Organization] codes!! But what else is there in such situations? Especially when dealing with a 'Master' database of dubious provenance ..." "OH F--- THIS. It's Sunday evening, I've worked all weekend, and just when I thought it was done, I'm hitting yet another problem that's based on the hopeless state of our databases." |
11-19-09 11-25-09 11-29-09 |
HARRY_READ_ME.txt Watts Up With That? Toronto Sun |
|||||||||||||||||||||||||||||||||||||||||||||||||||||||||||||||||||
|
East Anglia's Phil Jones wrote that he was using Michael Mann's "Nature trick" to "hide the decline" in actual temperature data. This was the same "trick" previously used by Mann to produce the infamous "hockey stick" temperature graphs which has since been totally discredited. |
11-19-09 12-05-09 |
East Anglia Email JoNova |
|||||||||||||||||||||||||||||||||||||||||||||||||||||||||||||||||||
|
East Anglia scientists broke the UK's Freedom of Information Act (FOIA) laws by refused to release the raw global temperature record data used in their climate computer models, despite repeated requests by scientists interested in attempting to review and reproduce their results. |
01-28-10 | UK Times Online | |||||||||||||||||||||||||||||||||||||||||||||||||||||||||||||||||||
|
When East Anglia scientists could no longer evade the FOIA requests to release their data, they then reported that all of the original global temperature data had been conveniently destroyed, insuring that no one would ever be able to check their results. However, in an email from Phil Jones to Michael Mann dated 02/02/05, Jones states: The two MMs have been after the CRU station data for years. If they ever hear there is a Freedom of Information Act now in the UK, I think I'll delete the file rather than send to anyone." And magically, it happened! |
08-13-09 11-19-09 11-24-09 |
The UK Register East Anglia Email Wall Street Journal |
|||||||||||||||||||||||||||||||||||||||||||||||||||||||||||||||||||
|
Shortly after the East Anglia scandal broke, it was revealed that the New Zealand government's National Institute of Water and Atmospheric Research (NIWA) was also found to have been manipulating its own temperature data to manufacture a rising trend. |
11-25-09 | Watts Up With That? | |||||||||||||||||||||||||||||||||||||||||||||||||||||||||||||||||||
|
Scientists from East Anglia created the website RealClimate.org in order to promote the anthropogenic global warming (AGW) message. William Connolley, a Green Party activist and software engineer, was one of the nine member on the newly formed team. He became an editor at Wikipedia and, starting in 2003, began rewriting climate-related entries so as to eliminate all references to information contradicting the AGW story. "'He rewrote articles on the politics of global warming and on the scientists who were skeptical of the band,' Solomon explains. 'Richard Lindzen and Fred Singer, two of the world's most distinguished climate scientists, were among his early targets, followed by others that the band especially hated, such as Willie Soon and Sallie Baliunas of the Harvard-Smithsonian Center for Astrophysics, authorities on the Medieval Warm Period.'" "Through his role as a Wikipedia administrator, Connolley is said to have created or rewritten 5,428 unique Wikipedia entries." "'When Connolley didn't like the subject of a certain article, he removed it — more than 500 articles of various descriptions disappeared at his hand,' Solomon wrote. 'When he disapproved of the arguments that others were making, he often had them barred — over 2,000 Wikipedia contributors who ran afoul of him found themselves blocked from making further contributions.'" "Facts about the Medieval Warm Period and criticism of global warming doctrine were purportedly scrubbed from Wikipedia's pages." |
12-21-09 | WND | |||||||||||||||||||||||||||||||||||||||||||||||||||||||||||||||||||
|
It was next discovered that, like East Anglia, NASA had been stonewalling Freedom of Information requests for over two years. Once the information was released, it was discovered that they too had been manipulating the temperature data and issuing false findings. |
12-03-09 | Washington Times | |||||||||||||||||||||||||||||||||||||||||||||||||||||||||||||||||||
|
Additional research into the temperature data for both Darwin, Australia and Russia show the extent of fraud used in manipulating the temperature data. |
12-08-09 12-16-09 |
Watts Up With That? UK Telegraph |
|||||||||||||||||||||||||||||||||||||||||||||||||||||||||||||||||||
|
A researcher reported that important tree ring growth data, used as a proxy for temperature reconstruction, was held by Queens University of Belfast, but that the University refused to make the data available for analysis. |
12-01-09 | PJ Media | |||||||||||||||||||||||||||||||||||||||||||||||||||||||||||||||||||
|
A former top climate scientist and NASA manager was convicted of defrauding the government of $50,000 by diverting these NASA climate funds to his wife's company, highlighting the role that government funding of climate research plays in driving the researchers to produce "results" that will keep the funds flowing. |
12-02-09 | Washington Examiner | |||||||||||||||||||||||||||||||||||||||||||||||||||||||||||||||||||
|
Ground-based temperature data sets such as those maintained by the Hadley Centre Climatic Research Unit, greatly exaggerate temperature rise when compared to the more reliable satellite-based readings taken of the lower troposphere. |
01-09-10 | Climate Conspiracy | |||||||||||||||||||||||||||||||||||||||||||||||||||||||||||||||||||
|
The IPCC governmental advisory report's claimed that the Himalayan glaciers were receding faster than anywhere else in the world and would be gone by 2035. Whoops, that estimate came from a report that predicted their demise by the year 2350. Sorry, for the alarm, it was just a typo! Additionally, the Himalayan glaciers were reported to currently cover 500,000 square kilometers when, in fact, the actual glaciers span roughly 33,000 square kilometers. Missed it by just over 1,500%! It was also revealed that Syed Hasnain, who made the original prediction, realized this and other errors in the IPCC report back in 2008, but did not inform the head of the IPCC, saying: "My job is not to point out mistakes." Of course, it was also later determined by Michael Zemp from the World Glacier Monitoring Service, that: "There are simply no observations available to make these sorts of statements." |
12-01-09 01-20-10 01-20-10 02-04-10 |
PJ Media CNN UK Times Online Yale Forum |
|||||||||||||||||||||||||||||||||||||||||||||||||||||||||||||||||||
|
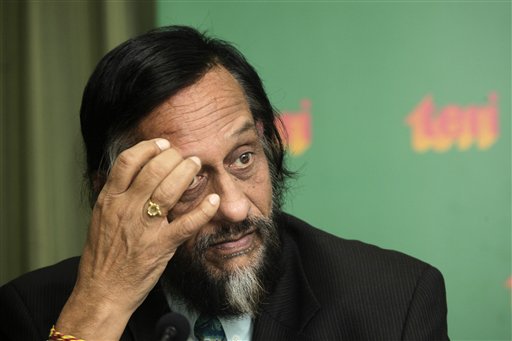
Dr Rajendra Pachauri, the head of the UN climate change panel, said that besides the Himalayan glacier error, there may be other errors in the IPCC report, but was not more specific. |
01-23-10 | UK Times Online | |||||||||||||||||||||||||||||||||||||||||||||||||||||||||||||||||||
|
The IPCC advisory report's claim that global warming is already affecting the severity and frequency of global disasters such as hurricanes and floods, was shown to be based upon a 2007 unpublished report that had not been subjected to peer-review. By the time the paper was actually published in 2008, it included the disclaimer: "We find insufficient evidence to claim a statistical relationship between global temperature increase and catastrophe losses." |
01-24-10 | The Observatory | |||||||||||||||||||||||||||||||||||||||||||||||||||||||||||||||||||
|
It was discovered that the IPCC claim that global warming might destroy 40% of the Brazilian rainforest, was based upon an unsubstantiated claim by eco-campaigners who had little scientific expertise. |
01-31-10 | UK Times Online | |||||||||||||||||||||||||||||||||||||||||||||||||||||||||||||||||||
|
It was discovered that the IPCC report incorrectly stated that 55% of the Netherlands was below sea level, when the actual figure is only 26%. Fact checking at the IPCC was so lax, that even simple errors such as this could and did find their way into its report. |
02-03-10 | Sott.net | |||||||||||||||||||||||||||||||||||||||||||||||||||||||||||||||||||
|
The IPCC published inaccurate data on the global production of wave powered electricity, which was also wrongly attributed to the website of a commercial wave-energy company. |
02-06-10 | UK Telegraph | |||||||||||||||||||||||||||||||||||||||||||||||||||||||||||||||||||
|
It was further discovered that the IPCC report contained:
|
02-06-10 | UK Telegraph | |||||||||||||||||||||||||||||||||||||||||||||||||||||||||||||||||||
|
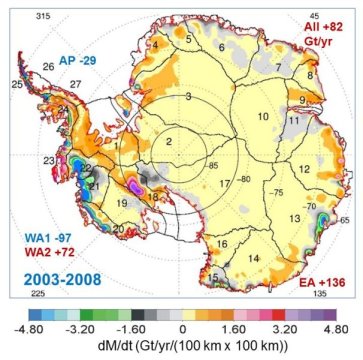
While doomsday predictions point to recent annual decreases in the total amount of Arctic ice, the record increases in the accumulating Antarctic ice and snow is conveniently ignored. "The doomsday portraits of Antarctica's glaciers reacting to a global climate change should be blurry at best. Consensus on changes in ice sheet thickness and their causes is difficult, and therefore of limited use on either side of the global warming debate." |
10-11-06 | World Climate Report | |||||||||||||||||||||||||||||||||||||||||||||||||||||||||||||||||||
|
Data concerning the warming of other planets in the solar system, indicating the sun as a major influence of earth's temperature rise, has been ignored by the AGW supporters. "But how do we square the fact that almost every planet in our solar system is simultaneously undergoing temperature change and volatile weather patterns. Does this not suggest that global warming is a natural cycle as a result of the evolving nature of the sun?" "Scientists from Nasa say that Mars has warmed by about 0.5C since the 1970s. This is similar to the warming experienced on Earth over approximately the same period. Since there is no known life on Mars it suggests rapid changes in planetary climates could be natural phenomena." |
11-16-06 04-29-07 |
Prison Planet UK Times Online |
|||||||||||||||||||||||||||||||||||||||||||||||||||||||||||||||||||
|
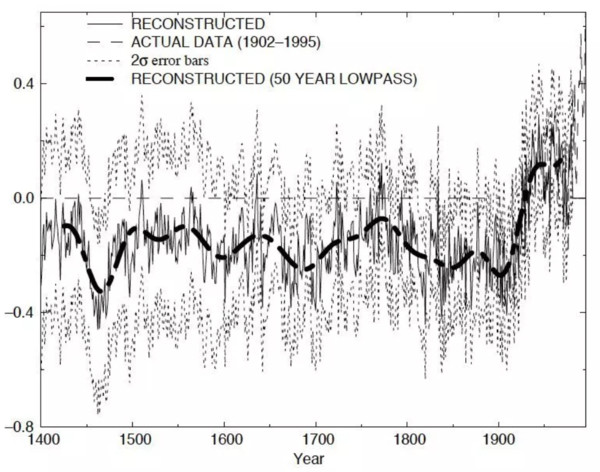
Warming trends in temperature data sets around the world are now seen to be due to local factors such as land development (Urban Heat Island Effect), and not attributable to actual global warming. Any actual warming experienced across the earth during the past 30 years is well within the normal temperature fluxuations seen at least twice before in the past 1,000 years. Quoting John Christy, a professor of atmospheric science at the University of Alabama in Huntsville, and a former lead author on the IPCC: "The temperature records cannot be relied on as indicators of global change" |
02-09-09 02-14-10 |
EPA UK Times Online |
|||||||||||||||||||||||||||||||||||||||||||||||||||||||||||||||||||
|
Phil Jones, the East Anglia Climate Research Unit scientist at the center of the Climategate scandal, admitted the following:
Sounds like "cover your ass" time to me! |
02-14-10 |
UK Mail Online |
|||||||||||||||||||||||||||||||||||||||||||||||||||||||||||||||||||
|
An examination of the data used to support the IPCC claims of a man-made increase in hurricanes and cyclones was cherry-picked to show the desired results. When all data was examined, no statistically significant increase is observed. |
02-15-10 | The UK Register | |||||||||||||||||||||||||||||||||||||||||||||||||||||||||||||||||||
|
In Britain, the Royal Society of Chemistry (RSC) and the Royal Statistical Society (RSS) both call for scientific data and evidence compiled by climate researchers to be made publicly available for scrutiny. The RSC said: "The apparent resistance of researchers from the CRU at the University of East Anglia to disclose research data has been widely portrayed as an indication of a lack of integrity in scientific research. ... It may also be necessary to incorporate an independent auditing system into peer review with the ability to demand access to raw data sets to ensure best practices are being adhered to." Dr Don Keiller, deputy head of life sciences at Anglia Ruskin University said: "What these emails reveal is a detailed and systematic conspiracy to prevent other scientists gaining access to CRU data sets. Such obstruction strikes at the very heart of the scientific method, that is the scrutiny and verification of data and results by one's peers." Professor Darrel Ince, from the department of computer science at the Open University said: "A number of climate scientists have refused to publish their computer programs; what I want to suggest is that this is both unscientific behaviour and, equally importantly ignores a major problem: that scientific software has got a poor reputation for error." |
03-07-10 | UK Telegraph | |||||||||||||||||||||||||||||||||||||||||||||||||||||||||||||||||||
|
Three of the world's four global temperature datasets have been shown to be be seriously tainted. This includes the data from: 1. East Anglia Climate Research Unit (CRU); 2. NASA's Goddard Institute for Space Studies (GISS); and 3. National Climatic Data Center (NCDC). The remaining Japanese dataset remains to be investigated. |
03-11-10 | PJ Media | |||||||||||||||||||||||||||||||||||||||||||||||||||||||||||||||||||
|
Japanese scientists, investigating arctic wind patterns determined that: "Much of the record breaking loss of ice in the Arctic ocean in recent years is down warming" "The study does not question that global warming is also melting ice in the Arctic, but it could raise doubts about high-profile claims that the region has passed a climate "tipping point" that could see ice loss sharply accelerate in coming years." |
03-22-10 | UK Guardian | |||||||||||||||||||||||||||||||||||||||||||||||||||||||||||||||||||
|
The UN admitted that a 2006 study showing that livestock (meat) production was responsible for 18% of the total greenhouse gas emissions — exceeding those produced by transportation — was flawed and overstated the impact. The UN had used this study to recommend less meat and milk production worldwide in the name of environmentalism. |
03-24-10 | UK Telegraph | |||||||||||||||||||||||||||||||||||||||||||||||||||||||||||||||||||
|
Nils-Axel Morner, the formerly chairman of the International Commission on Sea Level Change (INQUA), after spending the past 35 years studying sea levels around the world, declared that the talk about rising sea levels was a "colossal scare story". Quoting from the article: "Despite fluctuations down as well as up, 'the sea is not rising,' he says. 'It hasn't risen in 50 years.' If there is any rise this century it will 'not be more than 10cm (four inches), with an uncertainty of plus or minus 10cm'. And quite apart from examining the hard evidence, he says, the elementary laws of physics (latent heat needed to melt ice) tell us that the apocalypse conjured up by Al Gore and Co could not possibly come about." "The reason why Dr Morner, formerly a Stockholm professor, is so certain that these claims about sea level rise are 100 per cent wrong is that they are all based on computer model predictions, whereas his findings are based on 'going into the field to observe what is actually happening in the real world'." |
03-28-10 | UK Telegraph | |||||||||||||||||||||||||||||||||||||||||||||||||||||||||||||||||||
|
"Germans citizens are rapidly losing faith in global warming following the Climate-gate scandals, according to a new report in Der Spiegel." "Many people have little faith in the information and prognosis of climate researchers, The Local [a German news site] explained, with a third questioned in the survey not giving them much credence." |
03-29-10 | Fox News | |||||||||||||||||||||||||||||||||||||||||||||||||||||||||||||||||||
|
Mike Hulme and Martin Mahony, from the School of Environmental Sciences at the University of East Anglia, write in a paper entitled, Climate Change: what do we know about the IPCC?, that the consensus claims made by the IPCC in support of manmade global warming are fabrications. They state (pages 10-11): "Claims such as '2,500 of the world's leading scientists have reached a consensus that human activities are having a significant influence on the climate' are disingenuous. That particular consensus judgement, as are many others in the IPCC reports, is reached by only a few dozen experts in the specific field of detection and attribution studies; other IPCC authors are experts in other fields." |
04-12-10 | Hulme & Mahony | |||||||||||||||||||||||||||||||||||||||||||||||||||||||||||||||||||
|
Over 31,000 American scientists have signed a petition stating that there is no convincing evidence that human-related activities are causing catastrophic climate change, and urge the U.S. government to reject the Kyoto global warming agreement, along with all other similar proposals. |
05-06-10 | AGW Petition Project | |||||||||||||||||||||||||||||||||||||||||||||||||||||||||||||||||||
|
Arctic ice volume has increased 25% since May of 2008. "In 2008, less than half of the ice (47%) was greater than two metres thick. Now, more than 75% of the ice is greater than two metres thick. In 2008, 18% of the ice was more than three metres thick. This year that number has increased to 28%. There has been nearly across the board ice thickening since 2008. There was slightly more 4-5 metre ice in 2008, due to the big crunch in the summer of 2007." A very inconvenient fact. |
05-29-10 | Watts Up With That? | |||||||||||||||||||||||||||||||||||||||||||||||||||||||||||||||||||
|
In response to criticism over it corrupted temperature data (due to urban heat effects) and the fact that 90% of their climate measuring sites do not meet the government's own standards for obtaining accurate temperature measurements, the National Oceanic and Atmospheric Administration (NOAA) has simply redefined the nature of its collection methods so as to reassert the validity of the use of its data. On the NOAA website, it makes the following statement: "But for detecting climate change, the concern is not the absolute temperature — whether a station is reading warmer or cooler than a nearby station placed on grass — but how that temperature changes over time." All of which is so much handwaving, because if temperature increases are due to urban heat island effects, then it makes no difference whether those increases are absolute or relative, they have nothing to do with actual global temperature trends. NOAA then goes on to state: "Is there any question that surface temperatures in the United States have been rising rapidly during the last 50 years? No." As the article's author points out: "This is another clearly deceptive political answer. If one actually looks at the temperature trend in the United States over the last 50 years, you will see something quite different from what NOAA says. From 1960 to the late 1970s, the United States temperature was clearly falling. From that point on, there was a two-decade warming trend through the 1980s and 1990s. That warming trend ended in the late 1990s and there has been no warming since." |
06-12-10 | PJ Media | |||||||||||||||||||||||||||||||||||||||||||||||||||||||||||||||||||
|
The IPCC apparently relied upon the opinion of a single scientist, J. Lean, to author the chapter in its climate report which states that solar activity is not a major influencer of earth's climate. This conclusion runs counter to scientific research put forward by others such as Dr. Willie Soon, Henrik Svensmark and Nir Shaviv. The Norwegian government first noted the lack of evidence backing up the IPCC conclusion, and a representative stated: "I would encourage the IPCC to [re-]consider having only one solar physicist on the lead author team of such an important chapter. In particular since the conclusion of this section about solar forcing hangs on one single paper in which J. Lean is a coauthor." The article continues with the following statement: "Dr. Soon has presented solar irradiance data showing global temperatures during the past century have almost precisely mirrored solar output. The Danish National Space Center further reported that solar output by the end of the 20th century had reached its highest amount in at least 1,000 years." |
06-28-10 | The Heartland Institute | |||||||||||||||||||||||||||||||||||||||||||||||||||||||||||||||||||
|
Long after the infamous "hockey stick" temperature graph was discredited by showing that the data used to produce it had been heavily manipulated by its author Michael Mann, Mann himself now back-pedals in an attempt to distance himself from accepting full responsibility for its intent and use. As quoted from an article in the UK Telegraph: "[S]peaking to the BBC recently, Prof Mann, a climatologist at Pennsylvania State University, said he had always made clear there were "uncertainties" in his work. 'I always thought it was somewhat misplaced to make it a central icon of the climate change debate,' he said. " Oh, well OK then .... |
06-28-10 | UK Telegraph | |||||||||||||||||||||||||||||||||||||||||||||||||||||||||||||||||||
|
A new review of the United Nations' Intergovernmental Panel on Climate Change (IPCC) by the Netherlands Environmental Assessment Agency, concluded that the IPCC's 2007 report was biased towards overstating the negative consequences of any global warming, while ignoring the beneficial effects. "Maarten Hajer, director of the Netherlands Environmental Assessment Agency, which is funded by the Dutch government, said the IPCC's summary conclusions focused on the potential dangers of climate change because 'that is what the politicians wanted to know.'" "But since the 2007 report's publication, he said, 'the times have changed,' and the public now is demanding a fuller, more transparent look at how the IPCC comes up with its conclusions.'" In addition, the Dutch agency determined that the IPCC had made "another significant error" in projecting a 50-60% decrease in anchovy production off the west coast of Africa, due to "an erroneous interpretation of the literature references." "The literature in fact suggests a 50% to 60% decrease in 'extreme wind and seawater turbulence, with some effects on the anchovy population that were not quantified'." It is hard to believe that a supposedly scientific community, using peer review procedures, could allow errors of this magnitude to propagate through its literature for years by accident. Every new fact uncovered casts doubt on the validity and objectivity of all other aspects of the IPCC organization and on every one of its conclusions. |
07-05-10 | Wall Street Journal | |||||||||||||||||||||||||||||||||||||||||||||||||||||||||||||||||||
|
On April 14, 2010, The University of East Anglia reported that their own internal investigation, headed up by Lord Oxburgh, had concluded that Phil Jones, Keith Briffa, and other members of the Climate Research Unit (CRU) had conducted themselves in an exemplary manner, and all were exonerated of any wrongdoing. However, on July 19th, Anthony Watts reports: "Now from Bishop Hill we learn that it appears that the Oxburgh investigation let Dr. Phil Jones endorse what evidence (papers he's published) to review." So much for conduction an impartial inquiry! For additional information on the true nature of the "investigation", see the accompanying Climate Audit article by Steve McIntyre. [It also makes one wonder about the independence and accuracy of a similar internal investigation conducted by Penn State, which similarly cleared its professor, Michael Mann, of any wrongdoing.] |
07-19-10 |
Watts Up With That? Climate Audit |
|||||||||||||||||||||||||||||||||||||||||||||||||||||||||||||||||||
|
Further research into the satellite-based weather data compiled by the U.S. government-funded National Oceanic and Atmospheric Administration (NOAA) reveals that the record is seriously corrupted and may be inaccurately reporting values up to 15 degrees Fahrenheit in excess of actual real-world temperatures. For example:
Investigations have revealed that the temperature sensors is at least five of the weather satellites are seriously degraded and reporting inaccurately. "The U.S. physicist [Dr Charles R. Anderson] agrees there may now be thousands of temperatures in the range of 415-604 degrees Fahrenheit automatically fed into computer climate models and contaminating climate models with a substantial warming bias. This may have gone on for a far longer period than the five years originally identified. Anderson continues, 'One has to marvel at either the scientific incompetence this reveals or the completely unethical behavior of NOAA and its paid researchers that is laid open before us.'" "Dr. Anderson sums up saying; 'It is now perfectly clear that there are no reliable worldwide temperature records and that we have little more than anecdotal information on the temperature history of the Earth.'" |
08-09-10 08-19-10 |
Climate Change Dispatch Climate Change Dispatch |
|||||||||||||||||||||||||||||||||||||||||||||||||||||||||||||||||||
|
The Chicago Climate Exchange (CCX), the carbon "offset" trading project which was initiated by political insiders like Al Gore, to make a fortune off of the anticipated draconian "Cap-and-Trade" regulations that were to come out of Washington D.C. and other governmental bodies, collapsed, due in no small part to the changing political winds resulting from the Climategate affair. "Unlike most real markets, the carbon market was created by banks and governments so that new investment opportunities could seamlessly dovetail with specific government policies. It's a fantasy casino based on a doctrine of pure science fiction. Certainly, gaming the system has always been at the top on the agenda of the new green eco-trader. Most people, investors included, might innocently ask the fundamental question, "what's the point of having a CO2 commodities market?" The answer to that question should be obvious by now, and you can certainly look to the initial stakeholders in the various international climate trading bodies for a "Who's Who" list of individuals that have actively been pushing the global warming concept from its inception." |
08-28-10 | 21st Century Wire | |||||||||||||||||||||||||||||||||||||||||||||||||||||||||||||||||||
|
The Global Warming Policy Foundation of the UK reports that an international panel's review of all 18,531 sources referenced in the UN's IPCC report reveal that 5,587 were not peer reviewed, qualifying them as "grey literature" rather than as sound science, and despite IPCC chief Rajendra Pachauri's statement: "The IPCC uses only peer-reviewed scientific literature." |
07-30-10 | The GWP Foundation | |||||||||||||||||||||||||||||||||||||||||||||||||||||||||||||||||||
|
R. S. Knox and D. H. Douglass, from the Department of Physics and Astronomy, University of Rochester, recently published a paper in the International Journal of Geosciences titled, Recent energy balance of Earth, which disputes the ocean warming data and conclusions previously reported by J. M. Lyman and others. Rather than showing a positive rate of change resulting in a net energy storage increase, the data actually demonstrates a negative rate of change. As stated in the abstract: "A recently published estimate of Earth's global warming trend is 0.63 ± 0.28 W/m2, as calculated from ocean heat content anomaly data spanning 1993-2008. This value is not representative of the recent (2003-2008) warming/cooling rate because of a 'flattening' that occurred around 2001-2002. Using only 2003-2008 data from Argo floats, we find by four different algorithms that the recent trend ranges from -0.010 to -0.160 W/m2 with a typical error bar of ±0.2 W/m2. These results fail to support the existence of a frequently-cited large positive computed radiative imbalance." |
08-03-10 | International Journal of Geosciences | |||||||||||||||||||||||||||||||||||||||||||||||||||||||||||||||||||
|
The InterAcademy Council (IAC), a consortium of the world's top scientific academies, conducted a review of the the UN's IPCC report and determined the following: "A high-level inquiry into the Intergovernmental Panel on Climate Change found there was 'little evidence' for its claims about global warming." "It also said the panel had emphasised the negative impacts of climate change and made 'substantive findings' based on little proof." Also of interest is the following comment concerning IPCC chairman Dr Rajendra Pachauri: "Dr Pachauri has been accused of a conflict of interest, which he denies, after it emerged that he has business interests attracting millions of pounds in funding. One, the Energy Research Institute, is set to receive up to £10 million in grants from taxpayers over the next five years." |
08-31-10 | The UK Daily Express | |||||||||||||||||||||||||||||||||||||||||||||||||||||||||||||||||||
|
The faulty and manufactured global climate data was used to craft the Kyoto Protocol, which has then become the justification for significant pieces of legislation, such as California's Global Warming Solutions Act of 2006. Once this legislation was in place, regulators then applied tactical lessons learned from the Climategate "scientists", by exaggerating their estimates of pollution levels in order to further support their intervention into both personal behavior and business processes. As the San Francisco Chronicle reports: "California grossly miscalculated pollution levels in a scientific analysis used to toughen the state's clean-air standards [...] The pollution estimate in question was too high - by 340 percent, according to the California Air Resources Board" [Emphasis added] "Mary Nichols, chairwoman of the California Air Resources Board, offered no explanation when The Chronicle questioned her about the diesel emissions miscalculation. [...] Nichols was emphatic, though, when asked whether she has concerns about other scientific calculations made by air board scientists. 'No, no, no, no, no, no, no and no,' she said." What type of person maintain such rigid adherence to data that has already been shown to be off by 340 percent? This is only possible for those who have arrived at their conclusion independent from the data in the first place! |
10-08-10 | San Francisco Chronicle | |||||||||||||||||||||||||||||||||||||||||||||||||||||||||||||||||||
|
On October 8, 2010, Hal Lewis, Professor Emeritus of Physics at the University of California, Santa Barbara, resigned from the American Physical Society (APS) after sixty-seven years of membership. Here are a few excerpts from his letter of resignation: "For reasons that will soon become clear my former pride at being an APS Fellow all these years has been turned into shame, and I am forced, with no pleasure at all, to offer you my resignation from the Society. It is of course, the global warming scam, with the (literally) trillions of dollars driving it, that has corrupted so many scientists, and has carried APS before it like a rogue wave. It is the greatest and most successful pseudoscientific fraud I have seen in my long life as a physicist. Anyone who has the faintest doubt that this is so should force himself to read the ClimateGate documents, which lay it bare. (Montford's book organizes the facts very well.) I don't believe that any real physicist, nay scientist, can read that stuff without revulsion. I would almost make that revulsion a definition of the word scientist. So what has the APS, as an organization, done in the face of this challenge? It has accepted the corruption as the norm, and gone along with it. [...] I want no part of it, so please accept my resignation. APS no longer represents me ..." |
10-08-10 | Watts Up With That? | |||||||||||||||||||||||||||||||||||||||||||||||||||||||||||||||||||
|
William Connolley, a climate science blogger, was stripped of his editing position at Wikipedia, for his actions in falsifying and distorting the encyclopedia's climate science record. "His career as a global warming propagandist has now been stopped, following a unanimous verdict that came down today through an arbitration proceeding conducted by Wikipedia. In the decision, a slap-down for the once-powerful Connolley by his peers, he has been barred from participating in any article, discussion or forum dealing with global warming. In addition, because he rewrote biographies of scientists and others he disagreed with, to either belittle their accomplishments or make them appear to be frauds, Wikipedia barred him — again unanimously — from editing biographies of those in the climate change field." |
10-14-10 | Canadian National Post | |||||||||||||||||||||||||||||||||||||||||||||||||||||||||||||||||||
|
Upset with a cultural trend that is now moving away from a belief in the inevitability of an AGW climate crisis, the American Geophysical Union (AGU) has organized a group of climate researchers to fight back in an attempt to re-ignite a fire under this issue, which would then insure continued government research funding and the imposition of carbon legislation that is now all but dead. As John Abraham of St. Thomas University said: "This group feels strongly that science and politics can't be divorced ..." "The notion that truth will prevail is not working. The truth has been out there for the past two decades, and nothing has changed." If the AGU is not willing to rely upon the "truth" of their position, then what are they counting on? Science is an intellectual pursuit concerned only with the facts of reality, while government (i.e., politics) is a repository of force. Apparently the AGU is now preparing to apply a bit of force in order to "prevail"! Well, they've already tried subterfuge and lying, so what's left? |
11-08-10 | Los Angeles Times | |||||||||||||||||||||||||||||||||||||||||||||||||||||||||||||||||||
|
Using $1.1 million in grant money from the Joyce Foundation (of which Barack Obama was then a board member!), Richard Sandor founded the Chicago Climate Exchange (CCX) in 2000. The purpose of the exchange was to profit from what appeared to be the inevitable carbon cap-and-trade environmental regulations soon to be coming from governments around the world, and Al Gore was a major investor in this scheme. However, the Climategate scandal stuck a wrench into the political machinery, forestalling the passage of these bills, and the CCX along with it's counterpart, the European Climate Exchange (ECX), were sold to Intercontinental Exchange (ICE) on April 30, 2010. Now, just six months later, ICE has announced that it will suspend all carbon trading before the end of the year. "Al Capone tried to use Prohibition to muscle in on a piece of all the action in Chicago. The CCX's backers wanted to use a new prohibition on carbon emissions to muscle in on a piece of, quite literally, all the action in the world." "But according to an advisory posted to the exchange's website, participants simply didn't want to trade in carbon credits without a legal requirement that they do so." |
11-07-10 11-08-10 |
National Review Fox News | |||||||||||||||||||||||||||||||||||||||||||||||||||||||||||||||||||
|
Tom Nelson states: "After claiming that he never deleted any emails, Phil Jones now admits deleting emails." As reported in the UK Guardian on 11-24-09, Phil Jones is quoted as saying: "Some of the emails probably had poorly chosen words and were sent in the heat of the moment, when I was frustrated. I do regret sending some of them. We've not deleted any emails or data here at CRU. I would never manipulate the data one bit - I would categorically deny that." [Emphasis added] However, in a new article in Nature dated 11-15-10, when asked about deleting emails, he had this to say: "When Jones is now asked if he deleted such messages, he says: 'No, I deleted e-mails as a matter of course just to keep them under control.' "Then Muir Russell was correct? Had Jones broken the spirit of the law? 'Not necessarily, if you've deleted them ahead of time,' he says. 'You can't second guess what's going to be requested.' Jones goes back and forth on his motivations. Deleting e-mails would simplify his life if people requested them in the future, but that was not why he got rid of them, he says. 'I deleted them based on their dates. It was to keep the e-mails under control,' he repeats." [Emphasis added] |
11-15-10 11-24-09 11-15-10 |
Tom Nelson's Blog UK Guardian Nature |
|||||||||||||||||||||||||||||||||||||||||||||||||||||||||||||||||||
|
What is the real purpose of the United Nation's Intergovernmental Panel on Climate Change (IPCC)? Bernard Potter of the Swiss newspaper Neue Zurcher Zeitung, interviewed IPCC joint chairman Ottmar Edenhofer, and in an article titled IPCC Official: "Climate Policy Is Redistributing The World's Wealth", summarized his conclusion as follows: "Climate policy has almost nothing to do anymore with environmental protection, says the German economist and IPCC official Ottmar Edenhofer. The next world climate summit in Cancun is actually an economy summit during which the distribution of the world's resources will be negotiated." Specifically, Edenhofer had these comments: "[I]f global emission rights are distributed [...] on a per capita basis, then Africa will be the big winner, and huge amounts of money will flow there." "Basically it's a big mistake to discuss climate policy separately from the major themes of globalization. The climate summit in Cancun at the end of the month is not a climate conference, but one of the largest economic conferences since the Second World War." "[O]ne must say clearly that we redistribute de facto the world's wealth by climate policy. Obviously, the owners of coal and oil will not be enthusiastic about this. One has to free oneself from the illusion that international climate policy is environmental policy. This has almost nothing to do with environmental policy anymore." "[W]e need to see that successful climate policy requires other global trade and financial policies." "[T]here is always the risk that individual rationality leads to collective stupidity. Therefore, one cannot solve the climate problem alone, but it has to be linked to other problems. There must be penalties and incentives: global CO2-tariffs and technology transfer." |
11-18-10 | Global Warm. Policy Fdn. | |||||||||||||||||||||||||||||||||||||||||||||||||||||||||||||||||||
|
In an article titled "What happened to the 'warmest year on record': The truth is global warming has halted", David Rose reports the following: "But buried amid the details of those two Met [British Meteorological] Office statements 12 months apart lies a remarkable climbdown that has huge implications - not just for the Met Office, but for debate over climate change as a whole." "Read carefully with other official data, they conceal a truth that for some, to paraphrase former US Vice President Al Gore, is really inconvenient: for the past 15 years, global warming has stopped." "The question now emerging for climate scientists and policymakers alike is very simple. Just how long does a pause have to be before the thesis that the world is getting hotter because of human activity starts to collapse?" |
12-05-10 | UK Mail Online | |||||||||||||||||||||||||||||||||||||||||||||||||||||||||||||||||||
|
Never fear. It doesn't matter if it gets warmer or colder. It doesn't matter if it rains, snows or there is a prolonged drought. It doesn't matter if the weather is one thing here and something completely different elsewhere on the globe. It doesn't matter because the advocates of Anthropogenic Global Warming (AGW) will confirm that every bit of climate data, no matter what it happens to be, is a positive indicator of global warming. Quoting Anthony Watts in The Daily Caller: "From the Independent, March 20th, 2000: According to Dr David Viner, a senior research scientist at the climatic research unit (CRU) of the University of East Anglia, within a few years winter snowfall will become 'a very rare and exciting event.' 'Children just aren't going to know what snow is,' he said." "Now, for the second year in a row, the United Kingdom of Great Britain and Northern Ireland, Scotland, and Wales is covered with snow. Meanwhile, AGW proponents like the Guardian's George Monbiot are furiously spinning to make it look like AGW causes more snow, rather than less, as the CRU scientist said 10 years ago." And, quoting Dr. Richard North of the EU Referendum, commenting on George Monbiot's (i.e. "Moonbat") new defense of global warming: "It is not that he [Monbiot] does not have a case (even if it is not very good). What makes him so deservedly look the fool it that he, alongside the climate establishment, has spent the last decade or more trying to convince us that milder winters are a sure sign of global warming. Now, in the manner of Winston Smith, Moonbat seems to believe that he can rewrite history and we will not notice." |
12-24-10 12-24-10 |
The Daily Caller EUReferendum |
|||||||||||||||||||||||||||||||||||||||||||||||||||||||||||||||||||
|
We knew it was coming. With industrial carbon credit trading off the table for now, the environmental movement shifts its focus to the individual. As reported on EurActive, a European environmental site, in an article titled "Rio+20: UN hears fresh ideas to 'green' economy": "A UN meeting this week took stock of stakeholders' expectations for the Rio+20 summit on sustainable development, set to take place in 2012." "The 2012 summit is expected to agree on a political document that will guide action on sustainable development policy for decades to come and give birth to a World Environment Organisation." "A report summarising the submissions suggests that the green economy will rely on 'rigorously enforced environmental laws, taxation based on environmental impact' and 'personal carbon quotas'." "Personal carbon quotas relate to the maximum quantity of CO2 each of us may emit into the atmosphere per year without increasing the level of current global emissions." "On the economic aspects of green legislation, stakeholders admitted that 'a transition to a green economy will involve some winners and some losers'." "Some stakeholders even called for political commitments to stabilise the world's population to deal with increased pressure on natural resources. In late 2009, a UN report suggested that halting the rise in Earth's population would be a major help in the fight against global warming." |
01-13-11 | EurActive | |||||||||||||||||||||||||||||||||||||||||||||||||||||||||||||||||||
|
If you are a U.S. citizen, just how much of your money is wasted on 'Climate Change'? According to Art Horn in his PJ Media article, it is $10.6 million each and every day. "This year, your government will spend in the neighborhood of $4 billion on global warming research, despite the fact that there has been no global warming since 1998, and despite all of the billions that have been spent so far yielding no conclusive evidence that using fossil fuels to make energy has any significant effect on Earth's temperature. Check the American Association for the Advancement of Science's 2011 budget request, and go to chapter 15: Climate Change in the FY 2011 Budget. The numbers are staggering. In 2011, your government will spend $10.6 million a day to study, combat, and educate about climate change." |
01-15-11 | PJ Media | |||||||||||||||||||||||||||||||||||||||||||||||||||||||||||||||||||
|
Christopher Booker writes in The Telegraph, that the BBC and the British government's MET (meteorological) Office continue to play fast and loose with climate data and its reporting to the general public. For example, on the BBC program Horizon airing on 01-24-11, Booker reports: "The most telling moment, however, came in an interview between [Sir Paul] Nurse and a computer-modelling scientist from Nasa, presented as a general climate expert although he is only a specialist in ice studies. Asked to quantify the relative contributions of CO2 to the atmosphere by human and natural causes, his seemingly devastating reply was that 7 gigatons (billion tons) are emitted each year by human activity while only 1 gigaton comes from natural sources such as the oceans. This was so much the message they wanted that Nurse invited him to confirm that human emissions are seven times greater than those from all natural sources. This was mind-boggling. It is generally agreed that the 7 billion tonnes of CO2 due to human activity represent just over 3 per cent of the total emitted. That given off by natural sources, such as the oceans, is vastly greater than this, more than 96 per cent of the total. One may argue about the "carbon cycle" and how much CO2 the oceans and plants reabsorb. But, as baldly stated, the point was simply a grotesque misrepresentation, serving, like many of the programme's other assertions, only to give viewers a wholly misleading impression." Booker continued to give other example of bending the facts during the show. He then turned to a discussion of the MET Office's 01-20-11 issuing of a press release with the headline, "2010 &mdash a near record year", which claimed that 2010 was hotter than any other year in the past decade. Booker continues: "When [Dr Benny Peiser and Dr David Whitehouse, of the Global Warming Policy Foundation] examined the original data from which this claim was derived — compiled by the University of East Anglia's Climatic Research Unit and the Met Office's Hadley Centre — it clearly showed 2010 as having been cooler than 2005 (and 1998) and equal to 2003. It emerged that, for the purposes of the press release, the data had been significantly adjusted. Comparing the actual data for each year, from 2001 to 2010, with that given in the press release shows that for four years the original figure has been adjusted downwards. Only for 2010 was the data revised upwards, by the largest adjustment of all, allowing the Met Office to claim that 2010 was the hottest year of the decade." And so it goes with the propaganda machine. |
01-29-11 | UK Telegraph | |||||||||||||||||||||||||||||||||||||||||||||||||||||||||||||||||||
|
David Evans, a mathematician and engineer who has been consulting with the Australian Greenhouse Office and Department of Climate Change for over nine years, modeling carbon pools in agricultural systems, recently spoke to an Anti-Carbon-Tax Rally in Perth, Australia. These are excerpts from his remarks: "Let's set a few things straight. The whole idea that carbon dioxide is the main cause of the recent global warming is based on a guess that was proved false by empirical evidence during the 1990s." "The planet reacts to that extra carbon dioxide, which changes everything. Most critically, the extra warmth causes more water to evaporate from the oceans. But does the water hang around and increase the height of moist air in the atmosphere, or does it simply create more clouds and rain? Back in 1980, when the carbon dioxide theory started, no one knew. The alarmists guessed that it would increase the height of moist air around the planet, which would warm the planet even further, because the moist air is also a greenhouse gas." "Weather balloons had been measuring the atmosphere since the 1960s, many thousands of them every year. ... During the warming of the late 1970s, '80s and '90s, the weather balloons found no hot spot. ... This evidence proves that the climate models are fundamentally flawed, that they greatly overestimate the temperature increases due to carbon dioxide." "This evidence first became clear around the mid-1990s." "At this point, official "climate science" stopped being a science." "Finally, to those who still believe the planet is in danger from our carbon dioxide emissions: Sorry, but you've been had. Yes, carbon dioxide is a cause of global warming, but it's so minor it's not worth doing much about." Read the complete article for the full story. |
04-08-11 | Financial Post | |||||||||||||||||||||||||||||||||||||||||||||||||||||||||||||||||||
|
In 2005, the United Nations predicted that by 2010, there would be 50 million "climate refugees" created as a result of the consequences of climate change. This information was posted on their website, accompanied by a map showing the areas to be devastated by flooding, desertification, increased hurricane activity and ice cap and permafrost melting. Gavin Atkins of Asian Correspondent recently wondered What happened to the climate refugees?, and investigated the claims by looking at census data for many of the areas predicted to be most vulnerable. He discovered that populations in many of these regions had not decreased as people fled the purported havoc of global warming, but instead had increased substantially during the past decade. After Atkins article was published on April 11th and picked up by other news agencies, the UN quickly and quietly tried to cover up this latest mistake by removing the page and map from their site. However, thanks to Google Cache, both were able to be retrieved and can be viewed as part of the Daily Caller's article. But have no fear, for the UN, instead of apologizing for their gross error, is now stating that there will certainly be 50 million climate change refugees, only by 2020! |
04-16-11 | The Daily Caller | |||||||||||||||||||||||||||||||||||||||||||||||||||||||||||||||||||
|
In Forbes, Patrick Michaels discusses the steady stream of incorrect climate predictions that the United Nations has made over the past decade, from climate refugees (see above), to lost glaciers, to melting polar ice caps, to widespread destruction of rainforests, to severe coastal flooding, to droughts. He then makes the following very important observations: "Is all of this due to chance?" "Scientists, as humans, make judgemental errors. But what is odd about the UN is that its gaffes are all in one direction. All are exaggeration of the effects of climate change. ... No one has found analogous errors in the other direction." "In an unbiased world there should be an equal chance of either underestimating or overestimating the climate change and its effects, which allows us to test whether this string of errors is simply scientists behaving normally or being naughty." "What's the chance of throwing a coin six times and getting all heads (or tails)? It's .015. Most scientists consider the .050 level sufficient to warrant retention of a hypothesis, which in this case, is that the UN's climate science is biased." |
04-21-11 | Forbes | |||||||||||||||||||||||||||||||||||||||||||||||||||||||||||||||||||
|
In Forbes, James Taylor discusses the latest attempt by climate science researchers to fudge the data in order to create the desired end result. "Faced with the embarrassing fact that sea level is not rising nearly as much as has been predicted, the University of Colorado's NASA-funded Sea Level Research Group has announced it will begin adding a nonexistent 0.3 millimeters per year to its Global Mean Sea Level Time Series. As a result, alarmists will be able to present sea level charts asserting an accelerating rise in sea level that is not occurring in the real world." "United Nations Intergovernmental Panel on Climate Change (IPCC) computer models project approximately 15 inches of sea level rise during the 21st century." "Satellite measurements, however, show global sea level rose merely 0.83 inches during the first decade of the 21st century (a pace of just 8 inches for the entire century), and has barely risen at all since 2006. This puts alarmists in the embarrassing position of defending predictions that are not coming true in the real world." "[T]he current pace of 8 inches of sea level rise for the present century is essentially no different than the 7 inches of sea level rise that occurred last century. However, with an artificially enhanced 9.2 inches of sea level rise, alarmists can claim sea level is rising 31 percent faster than it did last century." |
05-11-11 | Forbes | |||||||||||||||||||||||||||||||||||||||||||||||||||||||||||||||||||
|
Just when the climate alarmists were thinking that things couldn't get any worse for their cause, scientists from the US National Solar Observatory (NSO) and the US Air Force Research Laboratory report that the sun appears to be heading into a sustained period of low solar activity which could result in a dramatic cooling leading to a mini Ice Age within the next decade. "The Sun normally follows an 11-year cycle of activity. The current cycle, Cycle 24, is now supposed to be ramping up towards maximum strength. Increased numbers of sunspots and other indications ought to be happening: but in fact results so far are most disappointing. Scientists at the NSO now suspect, based on data showing decades-long trends leading to this point, that Cycle 25 may not happen at all." "An immediate question is whether this slowdown presages a second Maunder Minimum, a 70-year period with virtually no sunspots [which occurred] during 1645-1715. Early records of sunspots indicate that the Sun went through a period of inactivity in the late 17th century. ... This period of solar inactivity also corresponds to a climatic period called the 'Little Ice Age' when rivers that are normally ice-free froze and snow fields remained year-round at lower altitudes." "The big consequences of a major solar calm spell, however, would be climatic. The next few generations of humanity might not find themselves trying to cope with global warming but rather with a significant cooling." |
06-14-11 | The UK Register | |||||||||||||||||||||||||||||||||||||||||||||||||||||||||||||||||||
|
James Hansen, the director of the Goddard Institute for Space Studies, and a very vocal proponent for Anthropogenic Global Warming, is accused of enriching himself by over $1.7 million, through contributions of funds and services from the environmental organizations whose agendas he actively promoted. "In a lawsuit filed Tuesday in Washington, D.C., a group claims NASA is withholding documents that show James Hansen failed to comply with ethics rules and financial disclosures regarding substantial compensation he earned outside his $180,000 taxpayer-paid position as director of the Goddard Institute for Space Studies." "Federal rules prohibit government employees from receiving certain types of income outside their job. Employees are required to file Form 17-60 in writing before any outside activity. And annually, they're required to submit Form SF 278, after receiving outside compensation." "Mark Hess, chief of communications for the Goddard Space Center, sent Fox News NASA's response to Horner's FOIA request. It said in many cases the documents Horner requested did not exist. Horner claims they should, if Hansen was complying with the law." Funds and services alleged to have been received include:
|
06-22-11 | Fox News | |||||||||||||||||||||||||||||||||||||||||||||||||||||||||||||||||||
|
If you can't beat 'em, brainwash 'em! The state of Maryland had added a mandatory course in "environmental literacy" to the requirements for graduation from high school. "But what is that? That is the question State Senator J. B. Jennings is asking. "Is it going to be fact-based? Or is it going to be theory-based, which is usually politically, theory driven. And you can think, it's going to be about global warming or climate change." "The new rule is a regulation from the State Board of Education, not a law passed by the legislature, so it lays out no specifics. Governor Martin O'Malley offers no real details but praises it, saying it will "infuse core subjects with lessons about conservation and smart growth and the health of our natural world." "That is not really education," says Ebell. "It's propaganda and its designed to raise up a new generation of easily led and poorly educated and misinformed students." |
06-27-11 | Fox News | |||||||||||||||||||||||||||||||||||||||||||||||||||||||||||||||||||
|
Just how dangerous is climate change? Well, according to the United Nations, it's apparently so deadly that the UN security council is contemplating the creation of an international "Green Helmet" security force that could "step into conflicts caused by shrinking resources" and "keep the peace in an era of climate change". "'A good first step would be to acknowledge the realities of climate change and its inherent implications to international peace and security,' [German ambassador to the UN Peter Wittig] wrote." "'The security council should join the general assembly in recognizing climate change as a threat to international peace and security. It is a threat as great as nuclear proliferation or global terrorism,' Marcus Stephen, the president of Nauru, wrote in a piece in the New York Times." Even though this is all just talk up to this point, a discussion concerning the creation of a military unit that justifies its use of force against people across the globe based upon environmental concerns, is chilling in its implications. This is nothing less than another attempt by the UN to redistribute the worlds wealth and resources through its Agenda 21 program, and to build an armed force that will impose it upon any recalcitrant nation or group of individuals. |
07-20-11 | UK Guardian | |||||||||||||||||||||||||||||||||||||||||||||||||||||||||||||||||||
|
New Research conducted at the European Organization for Nuclear Research (CERN) has demonstrated that the theory of the Dutch physicist, Henrik Svensmark, are correct and that the sun is primarily responsible for the variations in the earth's temperature. As Lawrence Solomon explains: "CERN [...] has now built a pristinely clean stainless steel chamber that precisely recreated the Earth's atmosphere. In this chamber, 63 CERN scientists from 17 European and American institutes have done what global warming doomsayers said could never be done — demonstrate that cosmic rays promote the formation of molecules that in Earth's atmosphere can grow and seed clouds, the cloudier and thus cooler it will be. Because the sun's magnetic field controls how many cosmic rays reach Earth's atmosphere (the stronger the sun's magnetic field, the more it shields Earth from incoming cosmic rays from space), the sun determines the temperature on Earth." However, following in the long standing tradition of government funded researchers and the main stream media, these results have been downplayed by CERN and gone unreported by the press. In an interview, Rolf-Dieter Heuer, the Director General of CERN said: "I have asked the colleagues to present the results clearly, but not to interpret them." Which led Nigel Calder to conclude: "CERN has joined a long line of lesser institutions obliged to remain politically correct about the man-made global warming hypothesis. It's OK to enter 'the highly political arena of the climate change debate' provided your results endorse man-made warming, but not if they support Svensmark's heresy that the Sun alters the climate by influencing the cosmic ray influx and cloud formation." "The once illustrious CERN laboratory ceases to be a truly scientific institute when its Director General forbids its physicists and visiting experimenters to draw the obvious scientific conclusions from their results." |
08-27-11 | UK Telegraph | |||||||||||||||||||||||||||||||||||||||||||||||||||||||||||||||||||
|
Just as back in October 2010, when Hal Lewis, Professor Emeritus of Physics at the University of California, Santa Barbara resigned from the American Physical Society (APS) over disputes regarding its climate-change position, now, on September 13, 2011, Nobel prize-winner, Dr. Ivar Giaever, has also resigned from that organization for similar reasons. In a letter to the APS, Dr. Giaever states: "Thank you for your letter inquiring about my membership. I did not renew it because I can not live with the statement below: Emissions of greenhouse gases from human activities are changing the atmosphere in ways that affect the Earth's climate. Greenhouse gases include carbon dioxide as well as methane, nitrous oxide and other gases. They are emitted from fossil fuel combustion and a range of industrial and agricultural processes. The evidence is incontrovertible: Global warming is occurring. If no mitigating actions are taken, significant disruptions in the Earth's physical and ecological systems, social systems, security and human health are likely to occur. We must reduce emissions of greenhouse gases beginning now. In the APS it is ok to discuss whether the mass of the proton changes over time and how a multi-universe behaves, but the evidence of global warming is incontrovertible? The claim (how can you measure the average temperature of the whole earth for a whole year?) is that the temperature has changed from ~288.0 to ~288.8 degree Kelvin in about 150 years, which (if true) means to me is that the temperature has been amazingly stable, and both human health and happiness have definitely improved in this 'warming' period." |
09-14-11 | Climate Depot | |||||||||||||||||||||||||||||||||||||||||||||||||||||||||||||||||||
|
New reports from the Competitive Enterprise Institute (CEI) indicate that the US Government, the EU and the UN's IPCC have colluded to create hidden communication channels, in order to conceal correspondence relating to the political agenda behind climate change research. "CEI has learned of a UN plan recently put in place to hide official correspondence on non-governmental accounts, which correspondence a federal inspector general has already confirmed are subject to FOIA. This 'cloud' serves as a dead-drop of sorts for discussions by U.S. government employees over the next report being produced by the scandal-plagued IPCC, which is funded with millions of U.S. taxpayer dollars." "This effort has apparently been conducted with participation — thereby direct assistance and enabling — by the Obama White House which, shortly after taking office, seized for Holdren's office the lead role on IPCC work from the Department of Commerce. The plan to secretly create a FOIA-free zone was then implemented." "This represents politically assisting the IPCC to enable UN, EU and U.S. bureaucrats and political appointees avoid official email channels for specific official work of high public interest, performed on official time and using government computers, away from the prying eyes of increasingly skeptical taxpayers.' |
10-17-11 | Watts Up With That? | |||||||||||||||||||||||||||||||||||||||||||||||||||||||||||||||||||
|
The Berkeley Earth Surface Temperature (BEST) project attempts to clarify the controversy surrounding the questionable temperature datasets used by past climate researchers, as noted in a number of the links above. This is being done by reanalyzing data from a far larger number of of temperature measuring stations (39,000 vs. 7,280) and then making the data and analysis public, available for peer review. Preliminary results from land-based measurements only (not including ocean temperature data) support the contention that global temperature is rising. However, as they report on their site: "Land warms more than oceans, so when we include the ocean we expect the total global warming to be less." Despite the missing ocean temperature data, the researchers, Richard and Elizabeth Muller and Robert Rohde, issued a preliminary report [no longer available] stating: "[The BEST] study finds reliable evidence of a rise in the average world land temperature of approximately 1 degree C since the mid-1950s." "The [BEST] study did not assess temperature changes in the oceans, which according to the Intergovernmental Panel on Climate Change (IPCC) have not warmed as much as land. When averaged in, they reduce the global surface temperature rise over the past 50 years — the period during which human effect on temperature is discernable — to about two thirds of one degree Centigrade." Notice the implication in the last paragraph that the temperature rise is due to human action, without actually stating it. Only later in the Wall Street Journal did Richard Muller, at the very end of his article, clarify this: "How much of the warming is due to humans and what will be the likely effects? We made no independent assessment of that." |
10-20-11 | BEST | |||||||||||||||||||||||||||||||||||||||||||||||||||||||||||||||||||
|
Anthony Watts discusses his agreements and disagreements with the Berkeley Earth Surface Temperature (BEST) preliminary results. A few of his agreements: "The Earth is warmer than it was 100-150 years ago. But that was never in contention - it is a straw man argument. The magnitude and causes are what skeptics question." "[The researchers] admit that the influence in recent decades of oceanic temperature cycles has been unappreciated and may explain most, if not all, of the global warming that has taken place, stating the possibility that the 'human component of global warming may be somewhat overstated.'" "The findings of the BEST global surface analysis match the finding of other global temperature metrics. This isn't surprising, as much of the same base raw data was used. There's a myth that NASA GISS, HadCRUT, NOAA's, and now Berkeley's source data are independent of one another. That's not completely true. They share a lot of common data from GHCN, administered by NOAA's National Climatic Data. So it isn't surprising at all they would match." And some of his disagreements: "The way they dealt with my surfacestation data in analysis was flat-out wrong, and I told them so days ahead of this release. They offered no correction, nor even an acknowledgement of the issue." "They didn't adequately deal with that 1% [urban regions] in my opinion, by doing a proper area weighting." "The rush to judgment they fomented before science had a chance to speak is worse than anything I've ever seen." |
10-21-11 | Watts Up With That? | |||||||||||||||||||||||||||||||||||||||||||||||||||||||||||||||||||
|
As expected, promoters of anthropogenic global warming (AGW) have jumped on the BEST data, claiming that it undercuts the position of AGW skeptics. For example, the lead-in to an article in The Economist reads: "A new analysis of the temperature record leaves little room for the doubters. The world is warming." The article is careful to avoid attributing the temperature rise to man-made causes, but the implication is clear — the doubters are those who are skeptical regarding man's responsibility for these rises. These implications are properly addressed by Matt Ridley on his blog, The Rational Optimist. |
10-22-11 10-23-11 |
The Economist The Rational Optimist |
|||||||||||||||||||||||||||||||||||||||||||||||||||||||||||||||||||
|
An article in the Canadian Free Press reports on the confluence of data pointing towards the possibility of a coming global cooling rather than warming period. "US solar physicists announced in June 2011 that the Sun appears to be headed into a lengthy spell of low activity, which could mean that the Earth — far from facing a global warming problem — is actually headed into a mini Ice Age. The announcement came from scientists at the US National Solar Observatory (NSO) and the US Air Force Research Laboratory. Three different analyses of the Sun's recent behavior all indicated that a period of unusually low solar activity may be about to begin." "Fred Dardick reports, 'We are in the midst of the convergence of three major solar, ocean, and atmospheric cycles all heading in the direction of global cooling. Last year the Southern Hemisphere experienced its coldest winter in 50 years and Europe just went through two particularly cold winters in a row, and the cooling trend has just begun. The likelihood of a repeat of the great frost of 1709 is growing every day.' This was the time of the Maunder Minimum (1645-1715) and for periods either side of it, many European rivers which are ice-free today — including the Thames — routinely froze over, allowing ice skating and even for armies to march across them in some cases." |
10-24-11 | Canadian Free Press | |||||||||||||||||||||||||||||||||||||||||||||||||||||||||||||||||||
|
"A government researcher who wrote a controversial report on dead polar bears was asked to take a polygraph test by a federal agent investigating allegations of scientific misconduct." "In 2006, Monnett and Gleason published a report describing their sightings of apparently drowned polar bears in the Arctic. The report drew public attention to the plight of the bears as the climate changes and ice melts." "Last year, someone at the Department of the Interior alleged that acts of scientific misconduct may have been committed in relation to that report." |
10-26-11 | NPR | |||||||||||||||||||||||||||||||||||||||||||||||||||||||||||||||||||
|
The UK Mail is reporting that Prof Judith Curry, the second named co-author of the four research papers released by the BEST (Berkeley Earth Surface Temperature) team, is refuting the claims of Professor Richard Muller, that the Earth continues to warm at the same rate observed during the last half of the 20th century. Excerpts from the article state: "Prof Judith Curry, who chairs the Department of Earth and Atmospheric Sciences at America's prestigious Georgia Institute of Technology, said that Prof Muller's claim that he has proven global warming sceptics wrong was also a 'huge mistake', with no scientific basis." "Like the scientists exposed then by leaked emails from East Anglia University's Climatic Research Unit, her colleagues from the BEST project seem to be trying to 'hide the decline' in rates of global warming." "In fact, Prof Curry said, the project's research data show there has been no increase in world temperatures since the end of the Nineties — a fact confirmed by a new analysis that The Mail on Sunday has obtained." "'There is no scientific basis for saying that warming hasn't stopped,' she said. 'To say that there is detracts from the credibility of the data, which is very unfortunate.'" "[A] report to be published today by the Global Warming Policy Foundation includes a graph of world average temperatures over the past ten years, drawn from the BEST project's data and revealed on its website." "This graph shows that the trend of the last decade is absolutely flat, with no increase at all — though the levels of carbon dioxide in the atmosphere have carried on rising relentlessly." And what does Professor Muller have to say about this: "[H]e admitted it was true that the BEST data suggested that world temperatures have not risen for about 13 years. But in his view, this might not be 'statistically significant', although, he added, it was equally possible that it was — a statement which left other scientists mystified." 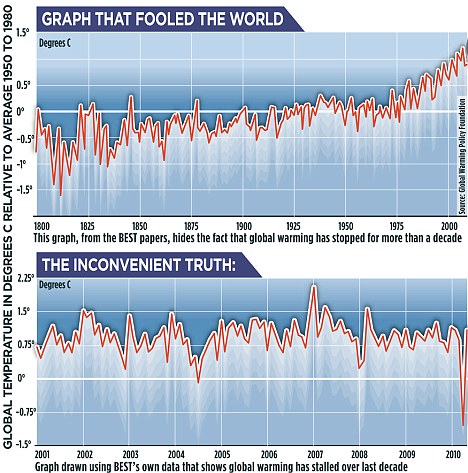
|
10-30-11 | UK Mail Online | |||||||||||||||||||||||||||||||||||||||||||||||||||||||||||||||||||
|
Japan's Aerospace Exploration Agency (JAXA) is reporting that the greenhouse gas observation satellite, IBUKI, which was launched in June 2009, shows that the most heavily industrialized areas of the world, including most of Europe and the eastern half of the United States, not only contribute less CO₂, but actually act as CO₂ absorbers. Quoting the article: "Bizarrely, the IBUKU [sic] maps prove exactly the opposite of all conventional expectations revealing that the least industrialized regions are the biggest emitters of greenhouse gases on the planet." "Yes, you read that correctly: the U.S. and western European nations are areas where CO2 levels are lowest. This new evidence defies the consensus view promoted by mainstream newspapers, such as the New York Times." "JAXA boasts that, 'we can reduce the error of the estimated values when we introduce IBUKI's observation data compared to that of the values calculated in a conventional way based on ground observation data.'" "Thus, the unthinkable could be made real: the greenhouse gas theory of climate change may collapse in the face of empirical evidence that industrialization is shown to have no link to global warming." |
10-30-11 | John O'Sullivan | |||||||||||||||||||||||||||||||||||||||||||||||||||||||||||||||||||
|
Following up on the recently released JAXA satellite data, Jo Nova published the charts for the CO₂ (shown below) and methane measurements, showing that the industrial, first-world countries predominantly act as carbon sinks (blue dots) while underdeveloped, third-world countries are net carbon producers (red dots). 
Quoting E.M. Smith from the Chiefio website: "This isn't that much of a surprise to me. I'd figured out some time ago that trees and bamboo could consume far more CO2 than I 'produce' via burning oil and gas. I've also pointed out that The West is largely letting trees grow, while mowing our lawns and having the clippings 'sequestered' in land fills (along with an untold tonnage of phone books and junk mail?) while the 3rd world is busy burning and cutting down their forests. The simple fact is that 'jungle rot' will beat out my 'gallon a day' of Diesel any time. Basically, we in the west grow far more wheat, corn, soybeans, wood, lawns, shrubs, etc. than we burn oil. In the 3rd world, they burn their sequestering plants. (And it takes one heck of a lot more wood to cook a meal than it does coal via a highly efficient furnace / electric generator / microwave oven.) But it's nice to see it documented in aggregate in the 'facts in the air'." |
11-03-11 | Jo Nova | |||||||||||||||||||||||||||||||||||||||||||||||||||||||||||||||||||
|
Anthony Watts reviews the National Climate Data Center (NCDC) data for the past decade in the United States and demonstrates that both summer and winter temperatures reveal a cooling trend. 
Additional charts provided in the article break down the data by geographic region. And when the data is examined over the past 15 years, starting in 1996, the trend line is almost completely flat, showing just a slight decrease in average temperature. |
11-05-11 | Watts Up With That? | |||||||||||||||||||||||||||||||||||||||||||||||||||||||||||||||||||
|
The Environmental Protection Agency (EPA) has been circulating a PDF slideshow which provides talking points used to bolster its ongoing claim for man-made global warming. In one example, the EPA displays two pictures showing the dramatic shrinking of Alaska's Muir Glacier between 1941 and 2004, stating that, "Glaciers in the United States and around the world have generally shrunk since the 1960s." 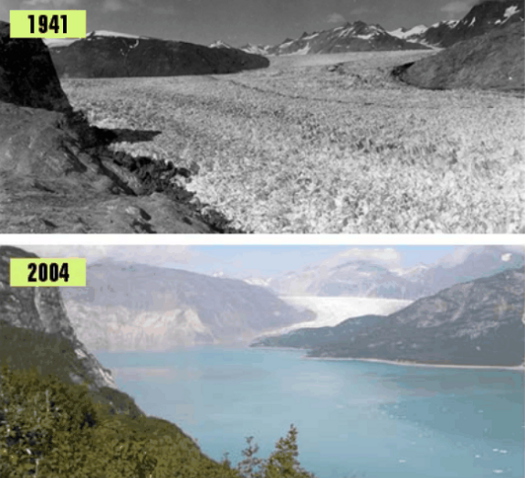
However, what the EPA so conveniently failed to mention was that there was nothing special about the 1960s date that they cherry picked, and that the Muir Glacier has been melting since at least the year 1760, with ten times the ice loss having occurred prior to the 1960s, as this USGS map reveals: 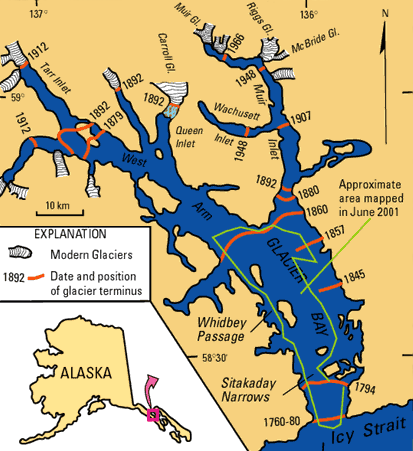
This is not just a misunderstanding of the data, but a clear example of how the government outright lies to the public as part of its effort to sell its program for expanding regulation and control over our lives. |
11-18-11 | Real Science | |||||||||||||||||||||||||||||||||||||||||||||||||||||||||||||||||||
|
It is not as if there was any need to further confirm the junk status of much of what has passed for climate science research, and yet a second round of hacked emails exchanges from the UK's Climate Research Unit at the University of East Anglia have just been released. Apparently culled from the same files taken back in 2009, these focus on the political agenda driving the climate message, and the role that the UN's Intergovernmental Panel on Climate Change (IPCC) has played in that regard. As James Delingpole puts it: "In other words, what these emails confirm is that the great man-made global warming scare is not about science but about political activism." Here are a few preliminary excerpts culled from the newly released material relating to the IPCC methodology: Bob Carter [on centralized decision-making]: "It seems that a few people have a very strong say, and no matter how much talking goes on beforehand, the big decisions are made at the eleventh hour by a select core group." Tom Wigley [on deception by the IPCC]: "Mike, The Figure you sent is very deceptive [...] there have been a number of dishonest presentations of model results by individual authors and by IPCC [...]" Jonathan Overpeck [on letting the ends justify the means]: "The trick may be to decide on the main message and use that to guid[e] what's included and what is left out." "I agree w/ Susan [Solomon] that we should try to put more in the bullet about "Subsequent evidence" [...] Need to convince readers that there really has been an increase in knowledge — more evidence. What is it?" Phil Jones [on packing the IPCC]: "Getting people we know and trust [into IPCC] is vital — hence my comment about the tornadoes group." "Useful ones [for IPCC] might be Baldwin, Benestad (written on the solar/cloud issue — on the right side, i.e anti-Svensmark), Bohm, Brown, Christy (will be [sic] have to involve him ?) Humphrey/DEFRA [on the governmental agenda]: "I can't overstate the HUGE amount of political interest in the project as a message that the Government can give on climate change to help them tell their story. They want the story to be a very strong one and don't want to be made to look foolish." "Somehow we have to leave the[m] thinking OK, climate change is extremely complicated, BUT I accept the dominant view that people are affecting it, and that impacts produces risk that needs careful and urgent attention." Phil Jones [on selectively manipulating the message] "We don't really want the bullshit and optimistic stuff that Michael has written [...] We'll have to cut out some of his stuff." Michael Mann [on manipulating the propaganda] "the important thing is to make sure they're loosing the PR battle. That's what the site [Real Climate] is about." Thomas J. Crowley [on how sociology trumps science] "I am not convinced that the "truth" is always worth reaching if it is at the cost of damaged personal relationships" Leopold Haimberger [on manipulating data to fit preconceptions] "It is interesting to see the lower tropospheric warming minimum in the tropics in all three plots, which I cannot explain. I believe it is spurious but it is remarkably robust against my adjustment efforts." Mike Hulme [on religious influences on science] "My work is as Director of the national centre for climate change research, a job which requires me to translate my Christian belief about stewardship of God's planet into research and action." Phil Jones [on circumventing Freedom of Information]: "I've been told that IPCC is above national FOI Acts. One way to cover yourself and all those working in AR5 would be to delete all emails at the end of the process" Keith Briffa [on circumventing Freedom of Information] "UEA does not hold the very vast majority of mine [potentially FOIable emails] anyway which I copied onto private storage after the completion of the IPCC task." However, of all the material released so far, the most damning are those where the participants speak casually of their fealty to "the cause" of global warming. This clearly demonstrates that it is not truth that they seek, but a preordained outcome that motivates their efforts, and science be damned. Consider the following — emphasis added: Michael Mann: "By the way, when is Tom C going to formally publish his roughly 1500 year reconstruction??? It would help the cause to be able to refer to that reconstruction as confirming Mann and Jones, etc." "They will (see below) allow us to provide some discussion of the synthetic example, referring to the J. Cimate [sic] paper (which should be finally accepted upon submission of the revised final draft), so that should help the cause a bit." I gave up on Judith Curry a while ago. I don't know what she think's she's doing, but its not helping the cause" Berger: "Many thanks for your paper and congratulations for reviving the global warming." |
11-22-11 |
UK Telegraph Washington Post Watts Up With That? TallBloke's TalkShop |
|||||||||||||||||||||||||||||||||||||||||||||||||||||||||||||||||||
|
The UK's Mail Online reports that the new round of Climategate 2.0 emails show how the British media conspired with the University of East Anglia (UEA) climate scientists to control the information that was presented to the public. Here are a few excerpts from this article: "Britain's leading green activist research centre spent £15,000 on seminars for top BBC executives in an apparent bid to block climate change sceptics from the airwaves" "[The emails] show that University staff vetted BBC scripts, used their contacts at the Corporation [BBC] to stop sceptics being interviewed and were consulted about how the broadcaster should alter its programme output." "BBC insiders say the close links between the Corporation and the UEA's two climate science departments, the Climatic Research Unit (CRU) and the Tyndall Centre for Climate Research, have had a significant impact on its coverage. " "In 2007, the BBC issued a formal editorial policy document, stating that 'the weight of evidence no longer justifies equal space being given to the opponents of the consensus' — the view that the world faces catastrophe because of man-made carbon dioxide emissions." |
11-27-11 | UK Mail Online | |||||||||||||||||||||||||||||||||||||||||||||||||||||||||||||||||||
|
Scientist Nils-Axel Morner has studied sea level data for 45 years, and has concluded that most of what the IPCC has to say on the subject is an outright fabrication. What follows are a few quotes from his article: "As someone with some expertise in the field, I can assure the low-lying countries that this is a false alarm. The sea is not rising precipitously. " "Our findings are straightforward: there is no ongoing sea level rise. The sea level there has been stable for the last 50 years or so, after falling some 20cm in around 1960; it was well below the present level in the 18th century and some 50 to 60cm above the present in the 17th century. So it is clear that sea levels rise and fall entirely independently of so-called 'climate change'." "But the best-known 'victim' of rising sea levels is, without doubt, the Maldives. This myth has been boosted by the opportunism of Mohamed Nasheed, who stars in a new documentary called The Island President. The film's tagline is 'To save his country, he has to save our planet'. It is a depressing example of how Hollywood-style melodrama has corrupted climate science. Nasheed has been rehearsing his lines since being elected in 2009. 'We are drowning, our nation will disappear, we have to relocate the people,' he repeatedly claims." "If this is what President Nasheed believes, it seems strange that he has authorised the building of many large waterside hotels and 11 new airports. Or could it perhaps be that he wants to take a cut of the $30 billion fund agreed at an accord in Copenhagen for the poorest nations hit by 'global warming'? Within two weeks of Copenhagen, the Maldives foreign minister Ahmed Shaheed wrote to the US secretary of state Hillary Clinton to express support for the accord." "The IPCC's Fourth Assessment claimed that 'there is strong evidence' of sea level rising over the last few decades. It goes as far as to claim: 'Satellite observations available since the early 1990s provide more accurate sea level data with nearly global coverage. This decade-long satellite altimetry data set shows that since 1993, sea level has been rising at a rate of around 3mm yr-1, significantly higher than the average during the previous half century. Coastal tide gauge measurements confirm this observation, and indicate that similar rates have occurred in some earlier decades.' Almost every word of this is untrue." "This is a scandal that should be called Sealevelgate. As with the Hockey Stick, there is little real-world data to support the upward tilt. It seems that the 2.3mm rise rate has been based on just one tide gauge in Hong Kong (whose record is contradicted by four other nearby tide gauges). Why does it show such a rise? Because like many of the 159 tide gauge stations used by the National Oceanic and Atmospheric Administration, it is sited on an unstable harbour construction or landing pier prone to uplift or subsidence. When you exclude these unreliable stations, the 68 remaining ones give a present rate of sea level rise in the order of 1mm a year." "We must learn to take the environmentalists' predictions with a huge pinch of salt. In 2005, the United Nations Environment Programme predicted that climate change would create 50 million climate refugees by 2010. That was last year: where are those refugees?" |
12-03-11 | UK Spectator | |||||||||||||||||||||||||||||||||||||||||||||||||||||||||||||||||||
|
Lord Christopher Monckton reports from the UN Climate Summit underway in Durban, South Africa. He summarizes the real purpose of the summit as follows: "The profiteering UN bureaucrats' ... plans to establish a world government paid for by the West on the pretext of dealing with the non-problem of 'global warming' are now well in hand." "Behind the scenes, throughout the year since Cancun, the now-permanent bureaucrats who have made highly-profitable careers out of what they lovingly call 'the process' have been beavering away at what is now a 138-page document. Its catchy title is 'Ad Hoc Working Group on Long-Term Cooperative Action Under the Convention'." "The contents of this document, turgidly drafted with all the UN's skill at what the former head of its documentation center used to call 'transparent impenetrability', are not just off the wall — they are lunatic." And what are some of the mail points in that document?
Read the entire report for the details. |
12-09-11 | Climate Depot | |||||||||||||||||||||||||||||||||||||||||||||||||||||||||||||||||||
|
Here is a chart showing the geological timeline of the earth's mean temperature. The area to the right indicates the recent history. Sort of puts things into perspective! |
12-14-11 | C3 Headlines | |||||||||||||||||||||||||||||||||||||||||||||||||||||||||||||||||||
|
Did the U.S. Government Help Hide Climate Data? A review of the Climategate 2.0 documents reveals that the Department of Energy may have been working in concert with the certain heads of climate research organizations in order to keep publicly funded raw climate data out of the "wrong hands". As reported in the Fox News article: "Dr. Phil Jones, told colleagues repeatedly that the U.S. Department of Energy was funding his data collection — and that officials there agreed that he should not have to release the data." "'Work on the land station data has been funded by the U.S. Dept of Energy, and I have their agreement that the data needn't be passed on. I got this [agreement] in 2007,' Jones wrote in a May 13, 2009, email to British officials, before listing reasons he did not want them to release data." "Two months later, Jones reiterated that sentiment to colleagues, saying that the data 'has to be well hidden. I've discussed this with the main funder (U.S. Dept of Energy) in the past and they are happy about not releasing the original station data.'" [...] "[C]limate change researcher and blogger Steve McIntyre forwarded FoxNews.com an email exchange from 2005 in which climate scientist Warwick Hughes asked an official at a DOE lab if he could get the data that the government paid Jones to collect." "'I am asking you to provide me with the following data ... DoE has been funding [the data] since the 1980s,' Hughes noted in his request.' "But Tom Boden, of the DOE's Oak Ridge National Laboratory, told Hughes at the time that the DOE itself did not have the data, and that 'you will need to contact Phil [Jones] directly. I spoke today with the DOE program manager who indicated Phil was not obligated under the conditions of past or present DOE proposal awards to provide these items.'" |
12-16-11 | Fox News | |||||||||||||||||||||||||||||||||||||||||||||||||||||||||||||||||||
|
Government agencies have stepped up their efforts to track down the person responsible for leaking the Climategate I and II correspondence. The U.S. Department of Justice has now sent a letter to three of the most prominent climate science skeptics, Tallbloke of Tallbloke's Talkshop, Steve McIntyre of Climate Audit and Jeff Id of The Air Vent, demanding that they preserve certain correspondence on their computers. In addition, the UK police conducted a raid on Tallbloke's home and confiscated two computers and a router. |
12-17-11 | American Thinker | |||||||||||||||||||||||||||||||||||||||||||||||||||||||||||||||||||
|
An open letter to all political candidates, signed by sixteen scientists, appeared in the Wall Street Journal. Here are a few excerpts: "A candidate for public office in any contemporary democracy may have to consider what, if anything, to do about 'global warming.' Candidates should understand that the oft-repeated claim that nearly all scientists demand that something dramatic be done to stop global warming is not true. In fact, a large and growing number of distinguished scientists and engineers do not agree that drastic actions on global warming are needed." "Perhaps the most inconvenient fact is the lack of global warming for well over 10 years now. [...] But the warming is only missing if one believes computer models where so-called feedbacks involving water vapor and clouds greatly amplify the small effect of CO2." "This is not the way science is supposed to work, but we have seen it before — for example, in the frightening period when Trofim Lysenko hijacked biology in the Soviet Union. " "Speaking for many scientists and engineers who have looked carefully and independently at the science of climate, we have a message to any candidate for public office: There is no compelling scientific argument for drastic action to 'decarbonize' the world's economy." "Every candidate should support rational measures to protect and improve our environment, but it makes no sense at all to back expensive programs that divert resources from real needs and are based on alarming but untenable claims of 'incontrovertible' evidence." |
01-27-12 | Wall Street Journal | |||||||||||||||||||||||||||||||||||||||||||||||||||||||||||||||||||
|
The MET (UK Meteorological Office) and the University of East Anglia Climatic Research Unit reported that a new assessment of more than 30,000 temperature measuring stations reveal that there has been no warming of the earth during the past 15 years. None. "Meanwhile, leading climate scientists [stated] that, after emitting unusually high levels of energy throughout the 20th Century, the sun is now heading towards a 'grand minimum' in its output, threatening cold summers, bitter winters and a shortening of the season available for growing food." Recent observations of the sun indicate that it is heading into Cycle 25 of sunspot activity. "According to a paper issued last week by the Met Office, there is a 92 per cent chance that both Cycle 25 and those taking place in the following decades will be as weak as, or weaker than, the 'Dalton minimum' of 1790 to 1830. In this period, named after the meteorologist John Dalton, average temperatures in parts of Europe fell by 2C." "However, it is also possible that the new solar energy slump could be as deep as the 'Maunder minimum' (after astronomer Edward Maunder), between 1645 and 1715 in the coldest part of the 'Little Ice Age' when, as well as the Thames frost fairs, the canals of Holland froze solid." The MET claims that the solar influence is small when compared to the effects of man-made CO₂, and will have minimal impact on global temperatures, but other experts disagree. Henrik Svensmark, the director of the Center for Sun-Climate Research at Denmark's National Space Institute states: "'It will take a long battle to convince some climate scientists that the sun is important. It may well be that the sun is going to demonstrate this on its own, without the need for their help.' He pointed out that, in claiming the effect of the solar minimum would be small, the Met Office was relying on the same computer models that are being undermined by the current pause in global-warming. " |
01-29-12 | UK Mail Online | |||||||||||||||||||||||||||||||||||||||||||||||||||||||||||||||||||
|
Climate alarmist groups, including 350.org, The League of Conservation Voters and Citizen Engagement Lab, have begun a campaign to replace the 63% of meteorologists who believe that global warming is the product of natural causes with those who will report the weather with a more anthropogenic global warming slant. "Concerned that too many 'deniers' are in the meteorology business, global warming activists this month launched a campaign to recruit local weathermen to hop aboard the alarmism bandwagon and expose those who are not fully convinced that the world is facing man-made doom." "'Our goal is nothing short of changing how the entire profession of meteorology tackles the issue of climate change,' the group explains on their website." In other words, these groups want to turn the entire profession of meteorology into a propaganda and indoctrination machine for their views. |
01-31-12 | The Daily Caller | |||||||||||||||||||||||||||||||||||||||||||||||||||||||||||||||||||
|
"The world's greatest snow-capped peaks, which run in a chain from the Himalayas to Tian Shan on the border of China and Kyrgyzstan, have lost no ice over the last decade, new research shows." "The discovery has stunned scientists, who had believed that around 50bn tonnes of meltwater were being shed each year and not being replaced by new snowfall." "The study is the first to survey all the world's icecaps and glaciers and was made possible by the use of satellite data. Overall, the contribution of melting ice outside the two largest caps — Greenland and Antarctica — is much less than previously estimated, with the lack of ice loss in the Himalayas and the other high peaks of Asia responsible for most of the discrepancy." "The reason for the radical reappraisal of ice melting in Asia is the different ways in which the current and previous studies were conducted. Until now, estimates of meltwater loss for all the world's 200,000 glaciers were based on extrapolations of data from a few hundred monitored on the ground. Those glaciers at lower altitudes are much easier for scientists to get to and so were more frequently included, but they were also more prone to melting." Oops! |
02-08-12 | UK Guardian | |||||||||||||||||||||||||||||||||||||||||||||||||||||||||||||||||||
|
Forty-nine former NASA scientists and astronauts sent a letter to the current administrator, expressing their displeasure at the space agency's advocacy of anthropogenic, CO₂-based, global warming (i.e., climate change), while ignoring evidence that undermines the theory. "We, the undersigned, respectfully request that NASA and the Goddard Institute for Space Studies (GISS) refrain from including unproven remarks in public releases and websites. We believe the claims by NASA and GISS, that man-made carbon dioxide is having a catastrophic impact on global climate change are not substantiated, especially when considering thousands of years of empirical data. With hundreds of well-known climate scientists and tens of thousands of other scientists publicly declaring their disbelief in the catastrophic forecasts, coming particularly from the GISS leadership, it is clear that the science is NOT settled. "The unbridled advocacy of CO2 being the major cause of climate change is unbecoming of NASA's history of making an objective assessment of all available scientific data prior to making decisions or public statements. "As former NASA employees, we feel that NASA's advocacy of an extreme position, prior to a thorough study of the possible overwhelming impact of natural climate drivers is inappropriate. We request that NASA refrain from including unproven and unsupported remarks in its future releases and websites on this subject. At risk is damage to the exemplary reputation of NASA, NASA's current or former scientists and employees, and even the reputation of science itself." |
04-10-12 | Watts Up With That? | |||||||||||||||||||||||||||||||||||||||||||||||||||||||||||||||||||
|
Anthony Watts reports on the newly published paper by Henrik Svensmark, demonstrating the high correlation between supernova events in our region of the galaxy and bio-diversity on the earth. This data supports Svensmark's theory that cosmic rays are the dominant controlling factor of earth's climate. He also inverts the CO₂ model as Watts explains: "Some geoscientists want to blame the drastic alternations of hot and icy conditions during the past 500 million years on increases and decreases in carbon dioxide, which they explain in intricate ways. For Svensmark, the changes driven by the stars govern the amount of carbon dioxide in the air. Climate and life control CO2, not the other way around." This chart shows the correlation between marine invertebrate genera count (bio-diversity) in blue, and supernova rates in black. 
The following chart by Watts, summarizes Svensmark's cosmic ray hypothesis: 
|
04-24-12 | Watts Up With That? | |||||||||||||||||||||||||||||||||||||||||||||||||||||||||||||||||||
|
According to a paper published back in 2000 in the Proceedings of the National Academy of Sciences, James Hansen and the GISS team stated: "..we argue that rapid warming in recent decades has been driven mainly by non-CO2 greenhouse gases (GHGs), such as chlorofluorocarbons, CH4, and N2O, not by the products of fossil fuel burning, CO2 and aerosols.. If sources of CH4 and O3 precursors were reduced in the future, the change in climate forcing by non-CO2 GHGs in the next 50 years could be near zero. Combined with a reduction of black carbon emissions and plausible success in slowing CO2 emissions, this reduction of non-CO2 GHGs could lead to a decline in the rate of global warming, reducing the danger of dramatic climate change." Oh well, when your previous work doesn't fit today's narrative, bury it! |
06-03-12 | Watts Up With That? | |||||||||||||||||||||||||||||||||||||||||||||||||||||||||||||||||||
|
Global warming: second thoughts of an environmentalist German green energy investor, Fritz Vahrenholt, rethinks his position on anthropogenic global warming. A few excerpts from his article: "Scientists of the Intergovernmental Panel on Climate Change (IPCC) are quite certain: by using fossil fuels man is currently destroying the climate and our future. We have one last chance, we are told: quickly renounce modern industrial society — painfully but for a good cause." "For many years, I was an active supporter of the IPCC and its CO2 theory. Recent experience with the UN's climate panel, however, forced me to reassess my position. In February 2010, I was invited as a reviewer for the IPCC report on renewable energy. I realized that the drafting of the report was done in anything but a scientific manner. The report was littered with errors and a member of Greenpeace edited the final version. These developments shocked me. I thought, if such things can happen in this report, then they might happen in other IPCC reports too." |
06-18-12 | UK Telegraph | |||||||||||||||||||||||||||||||||||||||||||||||||||||||||||||||||||
|
Using tree-ring data, scientists at the Johannes Gutenberg University in Mainz, Germany, have reconstructed temperatures over the past 2000 years, concluding that there has been an overall cooling trend during that period. "'We found that previous estimates of historical temperatures during the Roman era and the Middle Ages were too low,' says Esper. 'Such findings are also significant with regard to climate policy, as they will influence the way today's climate changes are seen in context of historical warm periods.'" "In addition to the cold and warm phases, the new climate curve also exhibits a phenomenon that was not expected in this form. For the first time, researchers have now been able to use the data derived from tree-rings to precisely calculate a much longer-term cooling trend that has been playing out over the past 2,000 years. Their findings demonstrate that this trend involves a cooling of -0.3°C per millennium due to gradual changes to the position of the sun and an increase in the distance between the Earth and the sun." "'This figure we calculated may not seem particularly significant,' says Esper. 'However, it is also not negligible when compared to global warming, which up to now has been less than 1°C. Our results suggest that the large-scale climate reconstruction shown by the Intergovernmental Panel on Climate Change (IPCC) likely underestimate this long-term cooling trend over the past few millennia.'" |
07-09-12 | Gutenberg University | |||||||||||||||||||||||||||||||||||||||||||||||||||||||||||||||||||
|
"New paper blames about half of global warming on weather station data homogenization. "Authors Steirou and Koutsoyiannis, after taking homogenization errors into account find global warming over the past century was only about one-half [0.42°C] of that claimed by the IPCC [0.7-0.8°C]." |
07-17-12 | Watts Up With That? | |||||||||||||||||||||||||||||||||||||||||||||||||||||||||||||||||||
|
Anthropogenic global warming (AGW) alarmist constantly refer to a 2009 survey that supposedly showed that 98% of all scientists believe in global warming, thus confirming an almost universal consensus on the subject. Is this true? Larry Bell took a closer look and reported his finding in Forbes. Here is what he discovered: The survey asked exactly two questions:
As the following chart shows, of 10,257 surveys sent, only 3,146 responded. Of those respondents, only 77 were found to have had a sufficient level of peer-reviewed publications to be considered suitable subjects. Of that small group, 75 answered yes to question #2. And this is how the 98% consensus figure was derived! 
Read the full articles for a more comprehensive review of the survey methodology. |
07-18-12 | Watts Up With That? | |||||||||||||||||||||||||||||||||||||||||||||||||||||||||||||||||||
|
A new paper to be published by Watts, Jones, McIntyre and Christy, titled, "An area and distance weighted analysis of the impacts of station exposure on the U.S. Historical Climatology Network temperatures and temperature trends," reanalyzes the surface temperature data measurement stations across the United States. Using a new classification system designed to better account for the siting of these devices, what this study shows is that temperature data reported by the National Oceanic and Atmospheric Administration (NOAA) has over-reported temperature rises by a factor of two. In other words, the reported North American temperature increases were double the actual amounts, leading to erroneous conclusions derived from this inaccurate data. The following chart summarizes the findings: 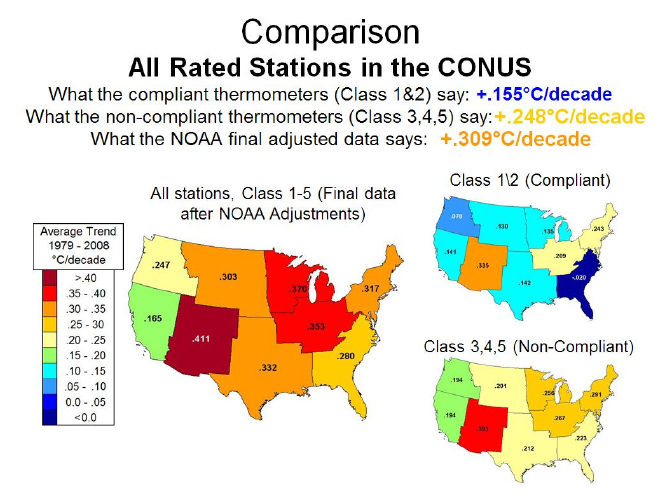
Link: Pre-Print Draft Discussion Paper – [PDF] Link: Supporting Figures and Tables for Paper – [PDF] |
07-29-12 | Watts Up With That? | |||||||||||||||||||||||||||||||||||||||||||||||||||||||||||||||||||
|
Richard Muller, a physics professor at he University of California at Berkeley and the head of the Berkeley Earth Surface Temperature (BEST) team, has been promoting himself as a prior climate skeptic who has recently "converted" to a believer in and supporter of the view that the earth is warming at alarming rates and that that warming is principally due to man's activity in producing CO₂. The Australian science writer, Jo Nova, takes Muller to task, declaring that of his three major claims, he gets only one half right.
|
07-31-12 | JoNova | |||||||||||||||||||||||||||||||||||||||||||||||||||||||||||||||||||
|
The National Snow & Ice Data Center (NSIDC) at the University of Colorado issued a widely distributed report claiming that Arctic sea ice had diminished to the lowest extent in recent era, breaking the previous low record established in 2007. Well what constitutes a "record" depends upon what data set you select. Here is the NSIDC ice extent chart, for 1979-2012: 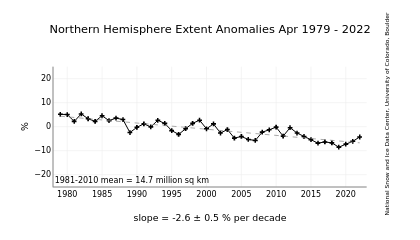 But, as Steven Goddard points out on his Real Science site, satellite data for polar cap ice data did not begin in 1979, but actually extends back to 1967. In the following chart, using data from a 1990 IPCC report, the rapid gain in polar ice between 1974 and 1979 is revealed, demonstrating that ice sheet extent at the poles is cyclical. 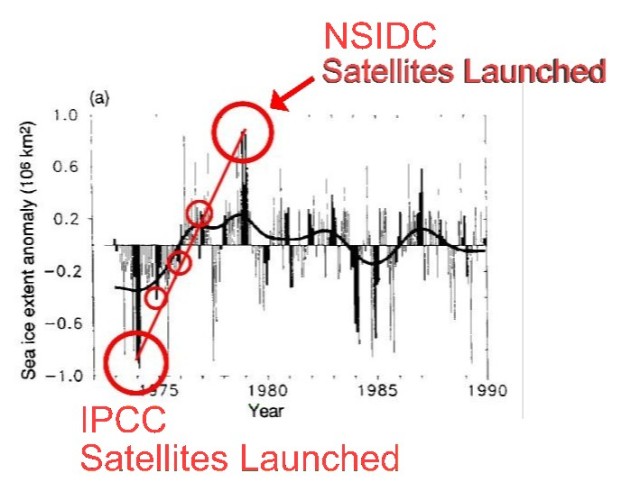 Only by selectively cherry-picking the data, are people fooled into believing that what is currently observed in the Arctic is a man-made catastrophe. Jonathan DuHamel has the following to say in his WryHeat column: "In an earlier announcement, NSIDC said 'Sea ice extent dropped rapidly between August 4 and August 8. While this drop coincided with an intense storm over the central Arctic Ocean, it is unclear if the storm prompted the rapid ice loss.' NSIDC called the storm 'The Great Arctic Cyclone of 2012' and noted the storm caused 'mechanical break up of the ice and increased melting by strong winds and wave action during the storm.' Nothing to do with global warming. A similar event happened in 2007 to cause the lower sea ice extent reported then." See his article (link to the right) for additional interesting information. |
08-26-12 08-27-12 08-28-12 |
Real Science NSIDC WryHeat |
|||||||||||||||||||||||||||||||||||||||||||||||||||||||||||||||||||
|
There has been no global warming — ZERO — during the past sixteen years. Be sure to keep it quiet! 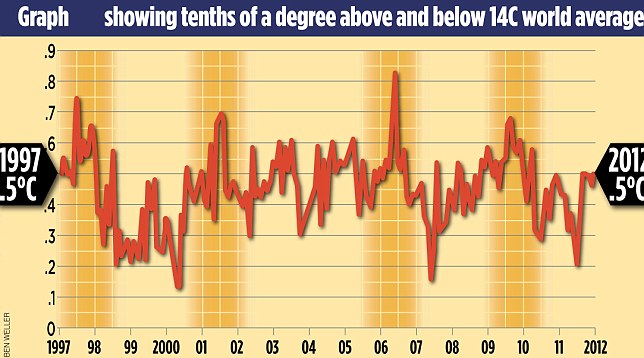 "The world stopped getting warmer almost 16 years ago, according to new data released last week. "The figures, which have triggered debate among climate scientists, reveal that from the beginning of 1997 until August 2012, there was no discernible rise in aggregate global temperatures. "This means that the 'plateau' or 'pause' in global warming has now lasted for about the same time as the previous period when temperatures rose, 1980 to 1996. Before that, temperatures had been stable or declining for about 40 years. "The new data, compiled from more than 3,000 measuring points on land and sea, was issued quietly on the internet, without any media fanfare, and, until today, it has not been reported. " |
10-13-12 | UK Mail Online | |||||||||||||||||||||||||||||||||||||||||||||||||||||||||||||||||||
|
The latest revelations out of the UK relate to how the BBC acted as a propaganda machine for the Anthropogenic Global Warming (AGW) movement. "Guiltiest of all, in my book, is the BBC. Without the BBC's relentless propagandising on behalf of the alarmist cause everywhere from the Today programme to Springwatch to the hysterically doom-mongering reportage of Roger Harrabin and David Shukman the public appetite for climate action at all costs would not have been nearly so strong or undiscriminating. Nor would our politicians have been quite so desperate to prove their green credentials with lunatic policies like the Climate Change Act." "The damage this has done to our country is incalculable: it has warped the minds of the young and impressionable, giving them utterly misleading notions about the state of climate science and the health of the planet; it has nudged our politicians into making truly fatuous decisions which have a deleterious influence on all our lives; it has lent a veneer of wholly unmerited moral credibility to the schemings of "green" politicians" |
11-02-12 | UK Telegraph | |||||||||||||||||||||||||||||||||||||||||||||||||||||||||||||||||||
|
While the final report is not due to be released for another year, "expert reviewer" Alec Rawls has leaked the Second Order Draft of AR5, the Working Group I's contribution to the IPCC Fifth Assessment Report Climate Change 2013: The Physical Science Basis. The full document may be found here. Quoting from IPCC Draft Report: "Many empirical relationships have been reported between GCR or cosmogenic isotope archives and some aspects of the climate system (e.g., Bond et al., 2001; Dengel et al., 2009; Ram and Stolz, 1999). The forcing from changes in total solar irradiance alone does not seem to account for these observations, implying the existence of an amplifying mechanism such as the hypothesized GCR-cloud link. We focus here on observed relationships between GCR and aerosol and cloud properties." [Emphasis added] And as Rawls then points out: "The admission of strong evidence for enhanced solar forcing changes everything. The climate alarmists can't continue to claim that warming was almost entirely due to human activity over a period when solar warming effects, now acknowledged to be important, were at a maximum. The final draft of AR5 WG1 is not scheduled to be released for another year but the public needs to know now how the main premises and conclusions of the IPCC story line have been undercut by the IPCC itself." [Emphasis added] Marc Morano of Climate Depot further reports on the findings of Dr. Roger Pielke Jr., a professor of environmental studies at the University of Colorado, who compared differences between the previous AR4 report and the current AR5 draft. Pielke states: "IPCC AR5 draft shows almost complete reversal from AR4 on trends in drought, hurricanes, floods and is now consistent with scientific literature" The C3 Headlines site provides the following charts using AR5 data: 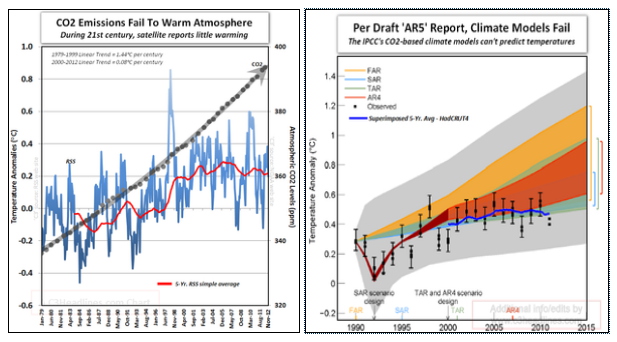
and from them concludes:
Anthony Watts also published the following chart which shows how the IPCC models of atmospheric methane, which have for years been projecting an accelerating rise, continue to massively exaggerate the concentrations in relation to reality. 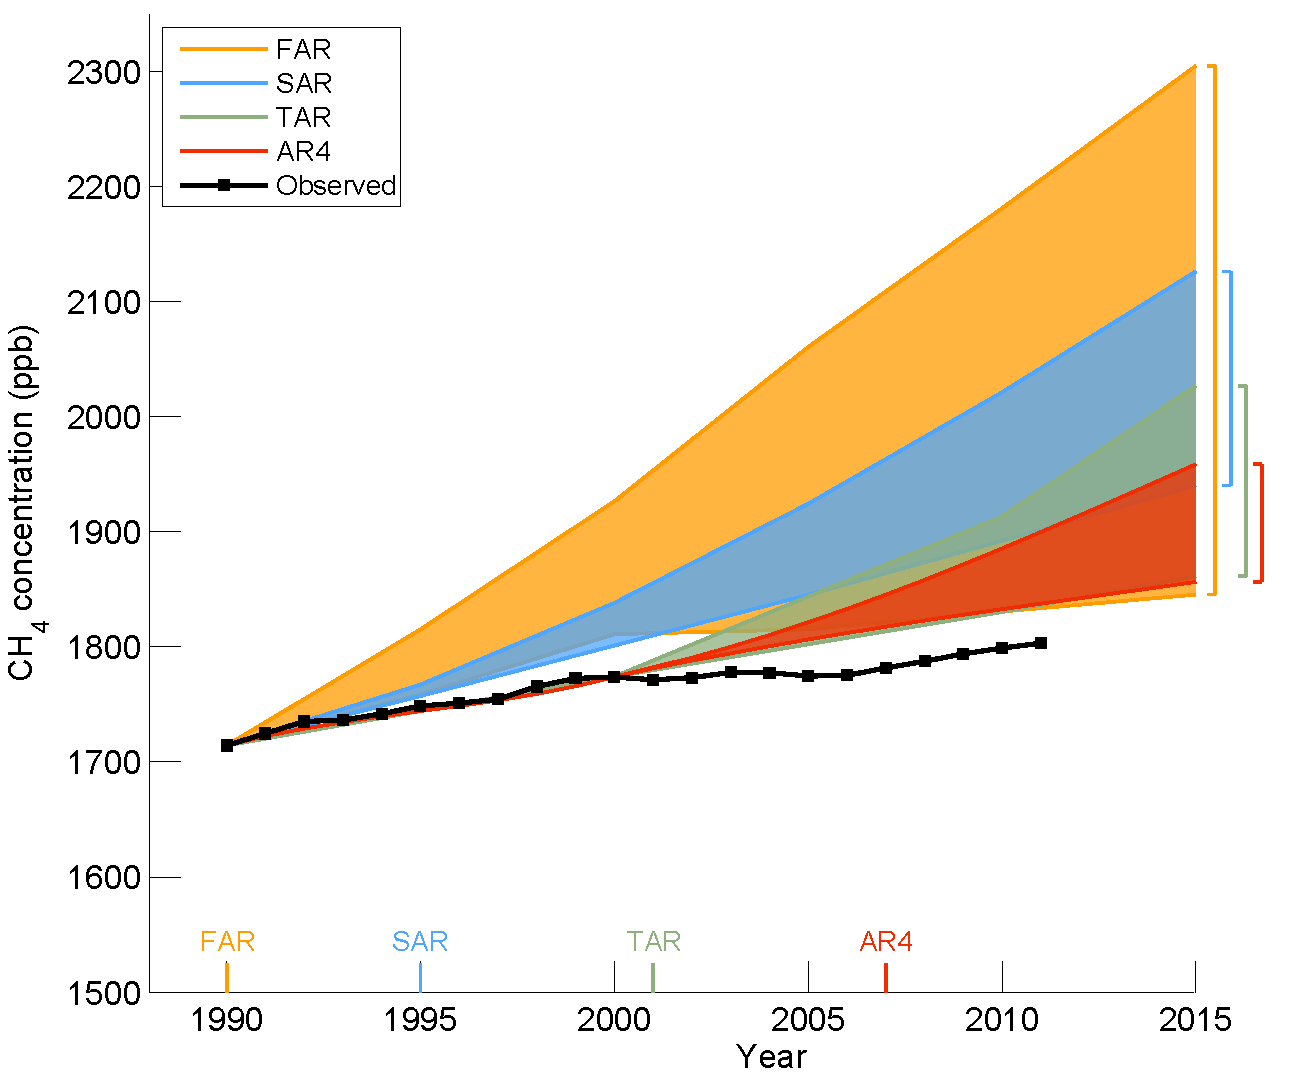
|
12-12-12 12-13-12 12-14-12 12-15-12 12-17-12 |
Alec Rawls Watts Up With That? Climate Depot C3 Headlines Watts Up With That? |
|||||||||||||||||||||||||||||||||||||||||||||||||||||||||||||||||||
|
The climate scientists at NASA, who in the past have played a very large role in promoting the view that global warming is primarily a manmade phenomenon (i.e., AGW), have now released a new report highlighting a "dawning realization" that the variability in the sun's radiant output may contribute significantly in determining the earth's overall climate. The article opens with: "In the galactic scheme of things, the Sun is a remarkably constant star. While some stars exhibit dramatic pulsations, wildly yo-yoing in size and brightness, and sometimes even exploding, the luminosity of our own sun varies a measly 0.1% over the course of the 11-year solar cycle. There is, however, a dawning realization among researchers that even these apparently tiny variations can have a significant effect on terrestrial climate. A new report issued by the National Research Council (NRC), "The Effects of Solar Variability on Earth's Climate," lays out some of the surprisingly complex ways that solar activity can make itself felt on our planet. Understanding the sun-climate connection requires a breadth of expertise in fields such as plasma physics, solar activity, atmospheric chemistry and fluid dynamics, energetic particle physics, and even terrestrial history. No single researcher has the full range of knowledge required to solve the problem. To make progress, the NRC had to assemble dozens of experts from many fields at a single workshop. The report summarizes their combined efforts to frame the problem in a truly multi-disciplinary context." That's quite a shift in viewpoint from the position, only a few short years ago, that the issue of AGW was a closed book with nearly universal scientific consensus. 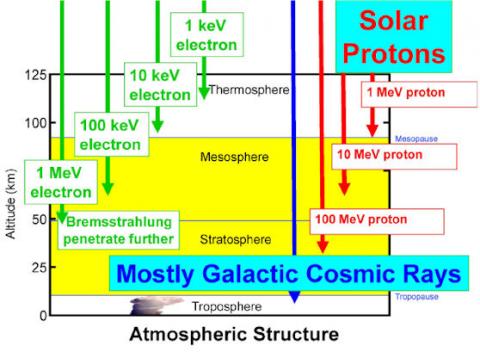
Accompanying the chart above, the report states: "Gerald Meehl of the National Center for Atmospheric Research (NCAR) presented persuasive evidence that solar variability is leaving an imprint on climate, especially in the Pacific." and "In recent years, researchers have considered the possibility that the sun plays a role in global warming. After all, the sun is the main source of heat for our planet. The NRC report suggests, however, that the influence of solar variability is more regional than global. The Pacific region is only one example." and "Raymond Bradley of UMass, who has studied historical records of solar activity imprinted by radioisotopes in tree rings and ice cores, says that regional rainfall seems to be more affected than temperature." and "Much has been made of the probable connection between the Maunder Minimum, a 70-year deficit of sunspots in the late 17th—early 18th century, and the coldest part of the Little Ice Age, during which Europe and North America were subjected to bitterly cold winters. The mechanism for that regional cooling could have been a drop in the sun's EUV output; this is, however, speculative. [...] Indeed, the sun could be on the threshold of a mini-Maunder event right now. [...] 'If the sun really is entering an unfamiliar phase of the solar cycle, then we must redouble our efforts to understand the sun-climate link,' notes Lika Guhathakurta of NASA's Living with a Star Program." and "Hal Maring, a climate scientist at NASA headquarters who has studied the report, notes that 'lots of interesting possibilities were suggested by the panelists. However, few, if any, have been quantified to the point that we can definitively assess their impact on climate.' Hardening the possibilities into concrete, physically-complete models is a key challenge for the researchers." Hmmm, maybe it's a good thing that those people skeptical of the viewpoint that man's activity had been conclusively proven to be the primary determinant in creating catastrophic global warming, were not put to death prematurely for considering that there might be other factors involved, or for questioning the logic chain leading from the available facts to the stated conclusions. |
01-08-13 | NASA Science News | |||||||||||||||||||||||||||||||||||||||||||||||||||||||||||||||||||
|
Back on 11-22-11, a second set of email correspondence was leaked from the UK's Climate Research Unit at the University of East Anglia. Included with that release was a password-protected encrypted file, presumably containing the remainder of the emails originally hacked. The assumption was that this "lock box" file was retained as protection against legal action which might be brought against the original hacker, "Mr. FOIA", should his identity be discovered. Today, blogger, Tom Nelson, received a message containing the password key. Here are a few excerpts from the accompanying letter: "Subject: FOIA 2013: the password" "It's time to tie up loose ends and dispel some of the speculation surrounding the Climategate affair." "Releasing the encrypted archive was a mere practicality. I didn't want to keep the emails lying around." "I prepared CG1 & 2 alone. Even skimming through all 220.000 emails would have taken several more months of work in an increasingly unfavorable environment." "Dumping them all into the public domain would be the last resort. Majority of the emails are irrelevant, some of them probably sensitive and socially damaging." "To get the remaining scientifically (or otherwise) relevant emails out, I ask you to pass this on to any motivated and responsible individuals who could volunteer some time to sift through the material for eventual release." "I don't expect these remaining emails to hold big surprises. Yet it's possible that the most important pieces are among them. Nobody on the planet has held the archive in plaintext since CG2." Read the entire article for a justification of why "Mr. FOIA" released the original batches of emails. |
01-13-13 | Tom Nelson's Blog | |||||||||||||||||||||||||||||||||||||||||||||||||||||||||||||||||||
|
James Taylor, reporting in Forbes, references a recent study which reports that: "Only 36 percent of geoscientists and engineers believe that humans are creating a global warming crisis, according to a survey reported in the peer-reviewed Organization Studies. By contrast, a strong majority of the 1,077 respondents believe that nature is the primary cause of recent global warming and/or that future global warming will not be a very serious problem." "People who look behind the self-serving statements by global warming alarmists about an alleged 'consensus' have always known that no such alarmist consensus exists among scientists. Now that we have access to hard surveys of scientists themselves, it is becoming clear that not only do many scientists dispute the asserted global warming crisis, but these skeptical scientists may indeed form a scientific consensus." Read the remainder of the article and associated report for additional details. |
02-13-13 |
Forbes Sage Journals |
|||||||||||||||||||||||||||||||||||||||||||||||||||||||||||||||||||
|
In a recent mathematical analysis by three German scientists, six overlapping natural cycles were discovered that account for almost all temperature change that has occurred over the past 250 years — the period for which high quality temperature records have been maintained. Their conclusion, assuming that they are correct in their model, is that the dominant cycles peaked around the year 2000 and that we are now rapidly moving towards cooler temperatures. They also conclude that human activity has played little role in determining the earth's past or current temperature. Read more here. |
05-01-13 | JoNova | |||||||||||||||||||||||||||||||||||||||||||||||||||||||||||||||||||
|
C02 Surpasses 400 ppm. So what? On May 10th, the National Oceanic and Atmospheric Administration (NOAA) announced that: "[T]he daily mean concentration of carbon dioxide in the atmosphere of Mauna Loa, Hawaii, surpassed 400 parts per million (ppm) for the first time since measurements began in 1958. ... It marks an important milestone because Mauna Loa, as the oldest continuous carbon dioxide (CO2) measurement station in the world, is the primary global benchmark site for monitoring the increase of this potent heat-trapping gas." So what does this mean? Well, it depends upon whom you ask. As reported at Climate Depot: "Former Vice President Al Gore declared the 400 ppm level 'A sad milestone. A call to action.' New York times reporter Justin Gillis compared trace amounts of CO2 to 'a tiny bit of arsenic or cobra venom' and warned that rising CO2 means 'the fate of the earth hangs in the balance.' The New Yorker Magazine declared 'Everything we use that emits carbon dioxide needs to be replaced with something that doesn't.' And a UK Guardian editorial declared 'Swift political action can avert a carbon dioxide crisis.'" Yet, despite all the doomsayers, as reported by Plant Fossils of West Virginia, and illustrated in the following chart, throughout the earth's history, atmospheric CO₂ has most typically ranged between 2,000 and 8,000 ppm (black line), with only one other significant drop to todays range of 400 ppm or less during the Carboniferous period. 
Also, note that the earth's average temperature (blue line) has only been as low as today's values twice in the past — during the late Ordovician and late Carboniferous Periods. What is particularly interesting is that despite CO₂ levels exceeding 4,000 ppm in the late Ordovician period, this coincided with an ice age! As the entire chart shows, there is no direct correlation between CO₂ and the earth's temperature. Until climate models can account for the actual known historical record, there is no reason to believe that they can do an accurate job of predicting the future. |
05-10-13 05-14-13 03-21-09 |
NOAA Climate Depot Plant Fossils of WV |
|||||||||||||||||||||||||||||||||||||||||||||||||||||||||||||||||||
|
In a Forbes article titled, "Global Warming Alarmists Caught Doctoring '97-Percent Consensus' Claims," information is reported concerning John Cook's paper which claims that there is a 97.2% endorsement by the scientific community of the AGW hypothesis that human actions are substantially responsible for global warming. Here is some of what the Forbes article has to say: "As is the case with other 'surveys' alleging an overwhelming scientific consensus on global warming, the question surveyed had absolutely nothing to do with the issues of contention between global warming alarmists and global warming skeptics. The question Cook and his alarmist colleagues surveyed was simply whether humans have caused some global warming. The question is meaningless regarding the global warming debate because most skeptics as well as most alarmists believe humans have caused some global warming. The issue of contention dividing alarmists and skeptics is whether humans are causing global warming of such negative severity as to constitute a crisis demanding concerted action." "Cook and his colleagues, for example, classified a peer-reviewed paper by scientist Craig Idso as explicitly supporting the 'consensus' position on global warming 'without minimizing' the asserted severity of global warming. When Popular Technology asked Idso whether this was an accurate characterization of his paper, Idso responded, 'That is not an accurate representation of my paper.' ... It would be incorrect to claim that our paper was an endorsement of CO2-induced global warming.?" "When Popular Technology asked physicist Nicola Scafetta whether Cook and his colleagues accurately classified one of his peer-reviewed papers as supporting the 'consensus' position, Scafetta similarly criticized the Skeptical Science classification." "'Cook et al. (2013) is based on a straw man argument because it does not correctly define the IPCC AGW theory, which is NOT that human emissions have contributed 50%+ of the global warming since 1900 but that almost 90-100% of the observed global warming was induced by human emission,' Scafetta responded. 'What my papers say is that the IPCC [United Nations Intergovernmental Panel on Climate Change] view is erroneous because about 40-70% of the global warming observed from 1900 to 2000 was induced by the sun.'" Read the entire article for many additional comments |
05-30-13 | Forbes | |||||||||||||||||||||||||||||||||||||||||||||||||||||||||||||||||||
|
Dr. Vincent Gray examines the historical record for both temperature and carbon dioxide levels and demonstrates that there is no correlation between the two. 
|
06-04-13 | Watts Up With That? | |||||||||||||||||||||||||||||||||||||||||||||||||||||||||||||||||||
|
The following video is a presentation given in Hamburg, Germany by Professor Murry Salby, discussing new research into the Relationship between Greenhouse Gases and Global Temperature. [Length: 1:32] Salby shows that all of the computerized climate models used today force CO₂ and global temperature to be completely linked, despite the fact that real world data does not come close to demonstrating this. CO₂ contributes 1% to the total Earth energy budget is, yet the models indicate that CO₂ is the primary driver of temperature, controlling the other 99% of sources. Salby concludes with the following points:
|
07-12-13 | YouTube | |||||||||||||||||||||||||||||||||||||||||||||||||||||||||||||||||||
|
The German Research Centre for Geosciences reports: "The Greenland ice sheet is melting from below, caused by a high heat flow from the mantle into the lithosphere. This influence is very variable spatially and has its origin in an exceptionally thin lithosphere. Consequently, there is an increased heat flow from the mantle and a complex interplay between this geothermal heating and the Greenland ice sheet. New research finds that this effect cannot be neglected when modeling the ice sheet as part of a climate study." "The current climate is influenced by processes that go far back into the history of Earth: the Greenland lithosphere is 2.8 to 1.7 billion years old and is only about 70 to 80 kilometers thick under Central Greenland. It remains to be explored why it is so exceptionally thin. It turns out, however, that the coupling of models of ice dynamics with thermo-mechanical models of the solid earth allows a more accurate view of the processes that are melting the Greenland ice." |
08-11-13 | Science Daily | |||||||||||||||||||||||||||||||||||||||||||||||||||||||||||||||||||
|
Anthony Watts reports that a new paper presented at the 19th International Conference on Nucleation and Atmospheric Aerosols, titled Cleaner Air: Brightening the Pollution Perspective? shows evidence that most or all of the cooling observed during the 1970s, along with the warming of the 80s and 90s, may be attributed to the darkening of the atmosphere due to pollutants, with a subsequent brightening resulting from implementation of pollution control laws. As the atmosphere became clearer, more solar radiation was able to reach the earth's surface, accounting for the increases in temperature through the process of insolation. 
Quoting from the authors' paper: "This study has demonstrated for the first time, using in-situ PM measurements, that reducing aerosol pollution is driving the Insolation Brightening phenomenon and that the trends in aerosol pollution, particularly for sulphate aerosol, is directly linked to anthropogenic emissions. Ultimately, the analysis demonstrates that clean air policies in developed regions such as Europe are driving brightening of the atmosphere and increasing the amount of global radiation reaching the Earth's surface. The actual impact of cleaner air and insolation brightening on temperature remains to be elucidated." |
08-19-13 | Watts Up With That? | |||||||||||||||||||||||||||||||||||||||||||||||||||||||||||||||||||
|
Here is a follow up to the fraud being perpetrated by John Cook and discussed two items above: "Cooks '97% consensus' disproven by a new peer reviewed paper showing major math errors" "A major peer-reviewed paper by four senior researchers has exposed grave errors in an earlier paper in a new and unknown journal that had claimed a 97.1% scientific consensus that Man had caused at least half the 0.7 C? global warming since 1950." "The consensus Cook considered was the standard definition: that Man had caused most post-1950 warming. Even on this weaker definition the true consensus among published scientific papers is now demonstrated to be not 97.1%, as Cook had claimed, but only 0.3%." "Only 41 out of the 11,944 published climate papers Cook examined explicitly stated that Man caused most of the warming since 1950. Cook himself had flagged just 64 papers as explicitly supporting that consensus, but 23 of the 64 had not in fact supported it." "Dr Legates said: 'It is astonishing that any journal could have published a paper claiming a 97% climate consensus when on the authors' own analysis the true consensus was well below 1%. It is still more astonishing that the IPCC should claim 95% certainty about the climate consensus when so small a fraction of published papers explicitly endorse the consensus as the IPCC defines it.'" |
09-03-13 | Watts Up With That? | |||||||||||||||||||||||||||||||||||||||||||||||||||||||||||||||||||
|
Governments are demanding that the 2013 UN IPCC report be modified to conceal the fact that the Earth's temperature has not risen during the past fifteen years. Quoting from an article in the UK's Mail Online: "Scientists working on the most authoritative study on climate change were urged to cover up the fact that the world's temperature hasn't risen for the last 15 years, it is claimed." "But leaked documents seen by the Associated Press, yesterday revealed deep concerns among politicians about a lack of global warming over the past few years. "Germany called for the references to the slowdown in warming to be deleted, saying looking at a time span of just 10 or 15 years was 'misleading' and they should focus on decades or centuries. "Hungary worried the report would provide ammunition for deniers of man-made climate change. "Belgium objected to using 1998 as a starting year for statistics, as it was exceptionally warm and makes the graph look flat — and suggested using 1999 or 2000 instead to give a more upward-pointing curve. "The United States delegation even weighed in, urging the authors of the report to explain away the lack of warming using the 'leading hypothesis' among scientists that the lower warming is down to more heat being absorbed by the ocean — which has got hotter." |
09-20-13 | UK Mail Online | |||||||||||||||||||||||||||||||||||||||||||||||||||||||||||||||||||
|
John C. Beale, the EPA's highest paid employee and climate change expert, was convicted of lying about his position in the CIA, using it as an excuse to not perform his job and bilking US taxpayers out of $1 million over a decade!. He was sentenced to 32 months in federal prison agreed to pay $1.3 million in restitution. Despite appearing to have spent little time on the job, his lawyer asked the sentencing judge to take into account his "years of admirable work," including:
I guess when it comes to climate change, "admirable work" doesn't actually require much work. "[Patrick] Sullivan [assistant inspector general] said he doubted Beale's fraud could occur at any federal agency other than the EPA. 'There's a certain culture here at the EPA where the mission is the most important thing,' he said. 'They don't think like criminal investigators. They tend to be very trusting and accepting.'" Well, OK then. |
12-18-13 |
NBC News NBC News |
|||||||||||||||||||||||||||||||||||||||||||||||||||||||||||||||||||
|
Dr. Tim Bell reports on how the IPCC has distorted the public perception of climate science by focusing on temperature and ignoring or minimizing the impact of all other climate phenomenon. "The Intergovernmental Panel on Climate Change (IPCC) set climate research back thirty years, mostly by focusing world attention on CO2 and higher temperature. It was a classic misdirection that required planning. The IPCC was created for this purpose and pursued it relentlessly. Through the World Meteorological Organization (WMO) they controlled national weather offices so global climate policies and research funding were similarly directed. "IPCC's definition of climate change narrowed the focus to human causes, but they exacerbated it by ignoring, downgrading or misusing variables. Most important and critical was water in all its forms and functions. The obsession restricted focus to higher temperatures and increased CO2, which directed funding of impact analyses, whether economic or environmental to cost only, instead of cost/benefit. Climate studies only considered temperature, usually and incorrectly attributing changes caused by precipitation to temperature. This practice was most evident in paleoclimate reconstructions, either done by IPCC participants or chosen for inclusion in the IPCC Reports." "The list of variables unmeasured, unknown or excluded from official IPCC science invalidates their models and their claims. Water in all its forms and functions is the most egregious. It also illustrates the degree of auto-correlation confronting climate research and understanding. It appears Wigley and therefore the IPCC knew of the problems but chose to sidestep them by carefully directing the focus — a scientific sleight of hand." |
12-27-13 | Watts Up With That? | |||||||||||||||||||||||||||||||||||||||||||||||||||||||||||||||||||
|
Bob Tisdale wrote an open letter to Jon Stewart, in response to clips and comments by Stewart which recently aired on The Daily Show. Tisdale makes a calm and reasoned presentation explaining what has changed regarding climate knowledge over the past few years. Here are quotes from a few interesting sections, but the entire article is worth a careful read. "The climate science community, under the direction of the IPCC (Intergovernmental Panel on Climate Change), has only been tasked with determining whether manmade factors, primarily carbon dioxide, could be responsible for the recent bout of global warming, and what the future might bring if the real world responds to projected increases in manmade greenhouse gases in ways that are similar to climate models. They were not asked to determine if naturally caused, sunlight-fueled processes could have caused the global warming over the past 30 years, or to determine the contribution of those natural factors in the future—thus all of the scrambling by climate scientists who are now trying to explain the hiatus in global warming. ... It is not the IPCC's role to understand the scientific basis for naturally caused climate change, which the Earth has experienced all along. As a result, even after decades of modeling efforts, climate models still cannot simulate naturally occurring ocean-atmosphere processes that contribute to global warming or stop it." "Data from the real world present an entirely different picture of extreme weather events. ...
"I'm sure you've heard of the global warming hiatus, the pause, etc. I presented the following in a post that I linked earlier, but it should be repeated. ... Looking at this realistically, if the climate models cannot explain the current slowdown or halt in global surface warming, then they cannot be used to explain the warming that had occurred from the mid-1970s to the late-1990s. In turn, they have little value as tools for making predictions of future climate. It's unfortunate, but that's the sad reality of the state of climate science today." |
01-17-14 | Watts Up With That? | |||||||||||||||||||||||||||||||||||||||||||||||||||||||||||||||||||
|
Steve Goddard has uncovered evidence that the National Oceanic and Atmospheric Administration (NOAA) has been manipulating its US Historical Climatology Network (USHCN) data. As he reviewed NOAA's Contiguous US Temperature graph, seen here ... 
... he noticed a discontinuity at 1998 which made no sense. What he discovered upon further investigation was that while the previous V1 temperature adjustments raised the actual measurement values from the 1960s onward, the newly applied V2 adjustments significantly lowered the temperature values prior to that date, thereby artificially changing the slope of the temperature trend line over the past 90 years from one that showed a moderate cooling to one showing a significant warming. Goddard identified other significant problems with the adjusted data and then concludes: "Bottom line is that the NCDC US temperature record is completely broken, and meaningless. Adjustments that used to go flat after 1990, now go up exponentially. Adjustments which are documented as positive, are implemented as negative." |
01-19-14 | Real Science | |||||||||||||||||||||||||||||||||||||||||||||||||||||||||||||||||||
|
Patrick Michaels writes in Forbes about reservations recently expressed by Garth Paltridge, a Chief Research Scientist at the Australian Commonwealth Scientific and Industrial Research Organization (CSIRO). Paltridge explains how the flow of government dollars into climate research has blinded scientists to the normal checks and balances of the scientific method, enticing them to support the UN's IPCC climate positions while ignoring facts and data. He concludes that this has forces many respected academic organizations into a corner in which they are now trapped. Paltridge writes: "The trap was fully sprung when many of the world's major national academies of science (such as the Royal Society in the UK, the National Academy of Sciences in the USA and the Australian Academy of Science) persuaded themselves to issue reports giving support to the conclusions of the IPCC [the United Nations' Intergovernmental Panel on Climate Change]. The reports were touted as national assessments that were supposedly independent of the IPCC and of each other, but of necessity were compiled with the assistance of, and in some cases at the behest of, many of the scientists involved in the IPCC international machinations. In effect, the academies, which are the most prestigious of the institutions of science, formally nailed their colours to the mast of the politically correct. Since that time three or four years ago, there has been no comfortable way for the scientific community to raise the spectre of serious uncertainty about the forecasts of climatic disaster." Because of this, Paltridge raises concerns over the overall effect that this will have on the credibility of science in general. "In the light of all this, we have at least to consider the possibility that the scientific establishment behind the global warming issue has been drawn into the trap of seriously overstating the climate problem—or, what is much the same thing, of seriously understating the uncertainties associated with the climate problem—in its effort to promote the cause. It is a particularly nasty trap in the context of science, because it risks destroying, perhaps for centuries to come, the unique and hard-won reputation for honesty which is the basis of society's respect for scientific endeavour." |
02-03-14 | Forbes | |||||||||||||||||||||||||||||||||||||||||||||||||||||||||||||||||||
|
The UKs Global Warming Policy Foundation recently released its GWPF Report 12, authored by Nicholas Lewis and Marcel Crok and titled, OVERSENSITIVE: How The IPCC Hid The Good News On Global Warming. In the report's executive summary, the authors state: "Only in recent years has it become possible to make good empirical estimates of climate sensitivity from observational data such as temperature and ocean heat records. These estimates, published in leading scientific journals, point to climate sensitivity per doubling most likely being under 2° C for long-term warming, and under 1.5° C over a seventy-year period. This strongly suggests that climate models display too much sensitivity to carbon dioxide concentrations and in almost all cases exaggerate the likely path of global warming. Although these new results are reported in the body of the recently-published Fifth Assessment Report of the Intergovernmental Panel on Climate Change (IPCC), their impact is not made clear and few readers of the report would learn of them. ... Good empirical estimates of both long-term warming and that over a seventy-year period now imply very different expectations of future warming than do climate models - some 40% to 50% lower to 2081-2100. This is almost certainly the most important finding of climate science in recent years, particularly since there are good reasons to doubt the reliability of climate model forecasts. However, in its report the IPCC only alludes to this issue in an oblique fashion. Moreover, rather than reducing its best estimate of climate sensitivity in the light of the new empirical estimates, it simply reduced the lower bound of the uncertainty range and omitted to give a best estimate, without adequately explaining why it had been necessary to do so. Only in the final report published in January 2014 was a paragraph added in the Technical Summary giving slightly more explanation." This is just another example of how the government-funded model of scientific research perverts science in the name of political goals. |
03-07-14 | GWPF Report 12 | |||||||||||||||||||||||||||||||||||||||||||||||||||||||||||||||||||
|
Richard Tol, an economics professor from England, has terminated his participation with the team writing the United Nation's report on climate change. This IPCC report is "intended to help governments reach global a climate pact at a U.N. summit in Paris in 2015." "'The drafts became too alarmist,' Tol told Reuters, acknowledging that some other authors 'strongly disagree with me.'" "Tol told Reuters the report plays down the possible economic benefits of low levels of warming, such as fewer deaths among the elderly in warmer winters and increased crop production in some regions. "'It is pretty damn obvious that there are positive impacts of climate change, even though we are not always allowed to talk about them,' he said. " |
03-28-14 | Fox News | |||||||||||||||||||||||||||||||||||||||||||||||||||||||||||||||||||
|
Quoting from Watts Up With That?: "Peer reviewed paper says it's OK to manipulate data, exaggerate climate claims." "From CFACT: A new peer-reviewed paper published in the American Journal of Agricultural Economics, titled "Information Manipulation and Climate Agreements", is openly advocating that global warming proponents engage in mendacious claims in order to further their cause." "The author's [sic] boldly note in the abstract of the study that the 'news media and some pro-environmental have the tendency to accentuate or even exaggerate the damage caused by climate change. This article provides a rationale for this tendency.' ... 'We find that the information manipulation has an instrumental value, as it ex post induces more countries to participate in an IEA (International Environmental Agreement) which will eventually enhance global welfare.'" 'Nuff said! |
04-04-14 | Watts Up With That? | |||||||||||||||||||||||||||||||||||||||||||||||||||||||||||||||||||
|
Nigel Lawson submits the text of a speech given to the Institute for Sustainable Energy and the Environment at the University of Bath. In it he summarizes the disconnect between the actual data and the climate projections made by the IPCC. |
05-01-14 | Watts Up With That? | |||||||||||||||||||||||||||||||||||||||||||||||||||||||||||||||||||
|
"Scientists Admit Polar Bear Numbers Were Made Up To 'Satisfy Public Demand?' Researchers with the IUCN Polar Bear Specialist Group (PBSG) recently admitted to experienced zoologist and polar bear specialist Susan Crockford that the estimate given for the total number of polar bars in the Arctic was "simply a qualified guess given to satisfy public demand." [...] Polar bears became the first species listed under the Endangered Species Act because they could potentially be harmed by global warming. But some recent studies have found that some polar bear subpopulations have actually flourished in recent years. [...] "All this glosses over what I think is a critical point: none of these 'global population estimates? (from 2001 onward) came anywhere close to being estimates of the actual world population size of polar bears (regardless of how scientifically inaccurate they might have been) — rather, they were estimates of only the subpopulations that Arctic biologists have tried to count," she added. |
05-30-14 | The Daily Caller | |||||||||||||||||||||||||||||||||||||||||||||||||||||||||||||||||||
|
Climate Science Explained in One Simple Graph 
Speaks for itself. |
08-31-14 | Real Science | |||||||||||||||||||||||||||||||||||||||||||||||||||||||||||||||||||
|
Here is a good editorial by Dr. Tim Ball, discussing the motives and methods behind the IPCC's actions regarding so called "Climate Change". Here are a few excerpts: "Skeptics have done a reasonable job of explaining what and how the IPCC created bad climate science. Now, as more people understand what the skeptics are saying, the question that most skeptics have not, or do not want to address is being asked — why?" [...] "Most find it hard to believe that a few people could fool the world. This is why the consensus argument was used from the start. Initially, it referred to the then approximately 6000 or so involved directly or indirectly in the IPCC. Later it was converted to the 97 percent figure concocted by Oreske, and later Cook. Most people don't know consensus has no relevance to science. The consensus argument also marginalized the few scientists and others who dared to speak out. "There were also deliberate efforts to marginalize this small group with terminology. Skeptics has a different meaning for science and the public. For the former they are healthy and necessary, for the latter an irritating non-conformist. When the facts contradicted the hypothesis, namely that temperature stopped rising while CO2 continued to increase, a more egregious name was necessary. In the latter half of the 20th century, a denier was automatically associated with the holocaust." [...] "Maurice Strong set out the problem, as he saw it, in his keynote speech in Rio in 1992. [...] The motive was to protect the world from the people, particularly people in the industrial world." The author actually only scratches the surface of what motivates those at the IPCC to propagate their Big Lie. For a fuller explanation, see the section on The Philosophy Behind The Environmental Movement. |
11-23-14 | Watts Up With That? | |||||||||||||||||||||||||||||||||||||||||||||||||||||||||||||||||||
|
The global temperature data manipulation game continues. "In recent years, these two very different ways of measuring global temperature have increasingly been showing quite different results. The surface-based record has shown a temperature trend rising up to 2014 as "the hottest years since records began". RSS and UAH have, meanwhile, for 18 years been recording no rise in the trend, with 2014 ranking as low as only the sixth warmest since 1997." "But two aspects of this system for measuring surface temperatures have long been worrying a growing array of statisticians, meteorologists and expert science bloggers. One is that the supposedly worldwide network of stations from which GHCN draws its data is flawed. Up to 80 per cent or more of the Earth's surface is not reliably covered at all. Furthermore, around 1990, the number of stations more than halved, from 12,000 to less than 6,000 - and most of those remaining are concentrated in urban areas or places where studies have shown that, thanks to the "urban heat island effect", readings can be up to 2 degrees higher than in those rural areas where thousands of stations were lost. To fill in the huge gaps, those compiling the records have resorted to computerised "infilling", whereby the higher temperatures recorded by the remaining stations are projected out to vast surrounding areas (Giss allows single stations to give a reading covering 1.6 million square miles). This alone contributed to the sharp temperature rise shown in the years after 1990." For example, here is the reported data for the Puerto Casado measuring station: 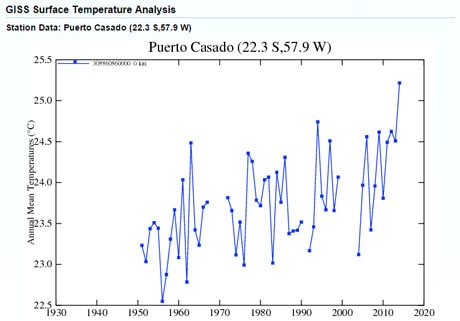
And here is the original raw data prior to manipulation: 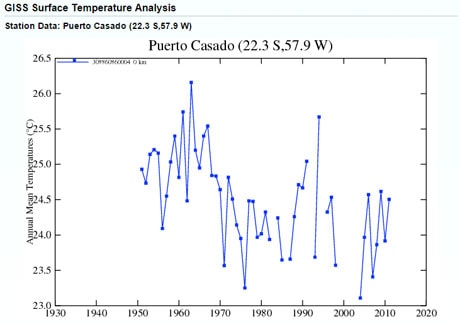
|
01-24-15 | UK Telegraph | |||||||||||||||||||||||||||||||||||||||||||||||||||||||||||||||||||
|
New investigations into the raw temperature data collected from Paraguay and the Arctic show further evidence that the data has been manipulated to falsely report "warming" that has not, in fact, occurred. "Two weeks ago, under the headline 'How we are being tricked by flawed data on global warming', I wrote about Paul Homewood, who, on his Notalotofpeopleknowthat blog, had checked the published temperature graphs for three weather stations in Paraguay against the temperatures that had originally been recorded. In each instance, the actual trend of 60 years of data had been dramatically reversed, so that a cooling trend was changed to one that showed a marked warming. "This was only the latest of many examples of a practice long recognised by expert observers around the world — one that raises an ever larger question mark over the entire official surface-temperature record." "Homewood has now turned his attention to the weather stations across much of the Arctic, between Canada (51 degrees W) and the heart of Siberia (87 degrees E). Again, in nearly every case, the same one-way adjustments have been made, to show warming up to 1 degree C or more higher than was indicated by the data that was actually recorded." "Of much more serious significance, however, is the way this wholesale manipulation of the official temperature record — for reasons GHCN and Giss have never plausibly explained — has become the real elephant in the room of the greatest and most costly scare the world has known. This really does begin to look like one of the greatest scientific scandals of all time. " |
02-07-15 | UK Telegraph | |||||||||||||||||||||||||||||||||||||||||||||||||||||||||||||||||||
|
It was not that long ago that Al Gore was widely publicizing the forecast of professor Wieslaw Maslowski: "Our projection of 2013 for the removal of [polar] ice in summer is not accounting for the last two minima, in 2005 and 2007. So given that fact, you can argue that may be our projection of 2013 is already too conservative." Well, 2013 came and went and the polar ice remained. Now there is another unfortunate dataset for the climate alarmists to address—or ignore as the case may be. As reported in Forbes: "Updated data from NASA satellite instruments reveal the Earth's polar ice caps have not receded at all since the satellite instruments began measuring the ice caps in 1979. Since the end of 2012, moreover, total polar ice extent has largely remained above the post-1979 average. The updated data contradict one of the most frequently asserted global warming claims — that global warming is causing the polar ice caps to recede." |
05-19-15 | Forbes | |||||||||||||||||||||||||||||||||||||||||||||||||||||||||||||||||||
|
"National Oceanic and Atmospheric Administration scientists have found a solution to the 15-year 'pause' in global warming: They 'adjusted' the hiatus in warming out of the temperature record. "New climate data by NOAA scientists doubles the warming trend since the late 1990s by adjusting pre-hiatus temperatures downward and inflating temperatures in more recent years." |
06-04-15 | The Daily Caller | |||||||||||||||||||||||||||||||||||||||||||||||||||||||||||||||||||
|
In this 12 minute video, Lord Christopher Monckton quickly outlines the economics—or the lack thereof—of large scale wind generators: specifically those being proposed in Canada. |
06-22-15 |
Ideacity 2015 YouTube |
|||||||||||||||||||||||||||||||||||||||||||||||||||||||||||||||||||
|
What the climate wars did to science "Scientists are terrible at making forecasts—indeed as Dan Gardner documents in his book Future Babble they are often worse than laymen. And the climate is a chaotic system with multiple influences of which human emissions are just one, which makes prediction even harder. "The IPCC actually admits the possibility of lukewarming within its consensus, because it gives a range of possible future temperatures: it thinks the world will be between about 1.5 and four degrees warmer on average by the end of the century. That's a huge range, from marginally beneficial to terrifyingly harmful, so it is hardly a consensus of danger, and if you look at the "probability density functions" of climate sensitivity, they always cluster towards the lower end. "What is more, in the small print describing the assumptions of the "representative concentration pathways", it admits that the top of the range will only be reached if sensitivity to carbon dioxide is high (which is doubtful); if world population growth re-accelerates (which is unlikely); if carbon dioxide absorption by the oceans slows down (which is improbable); and if the world economy goes in a very odd direction, giving up gas but increasing coal use tenfold (which is implausible)." [...] "Barack Obama says that 97 per cent of scientists agree that climate change is "real, man-made and dangerous". That's just a lie (or a very ignorant remark): as I point out above, there is no consensus that it's dangerous. "So where's the outrage from scientists at this presidential distortion? It's worse than that, actually. The 97 per cent figure is derived from two pieces of pseudoscience that would have embarrassed a homeopath. The first was a poll that found that 97 per cent of just seventy-nine scientists thought climate change was man-made—not that it was dangerous. A more recent poll of 1854 members of the American Meteorological Society found the true number is 52 per cent. "The second source of the 97 per cent number was a survey of scientific papers, which has now been comprehensively demolished by Professor Richard Tol of Sussex University, who is probably the world's leading climate economist. As the Australian blogger Joanne Nova summarised Tol's findings, John Cook of the University of Queensland and his team used an unrepresentative sample, left out much useful data, used biased observers who disagreed with the authors of the papers they were classifying nearly two-thirds of the time, and collected and analysed the data in such a way as to allow the authors to adjust their preliminary conclusions as they went along, a scientific no-no if ever there was one. The data could not be replicated, and Cook himself threatened legal action to hide them. Yet neither the journal nor the university where Cook works has retracted the paper, and the scientific establishment refuses to stop citing it, let alone blow the whistle on it. Its conclusion is too useful." [...] "I dread to think what harm this episode will have done to the reputation of science in general when the dust has settled. Science will need a reformation. Garth Paltridge is a distinguished Australian climate scientist, who, in The Facts, pens a wise paragraph that I fear will be the epitaph of climate science: "We have at least to consider the possibility that the scientific establishment behind the global warming issue has been drawn into the trap of seriously overstating the climate problem—or, what is much the same thing, of seriously understating the uncertainties associated with the climate problem—in its effort to promote the cause." |
07-05-15 | Matt Ridley's Blog | |||||||||||||||||||||||||||||||||||||||||||||||||||||||||||||||||||
|
Journalist Donna Laframboise investigated the personnel behind the IPCC and came to the surprising conclusions that much of the management and many of the authors behind their report are unqualified and have a biased agenda. She discusses these findings in this video. Laframboise has delineated her findings regarding the IPCC in these two books
|
07-08-15 |
Donna Laframboise
YouTube |
|||||||||||||||||||||||||||||||||||||||||||||||||||||||||||||||||||
|
As noted above, on September 13, 2011, Nobel prize-winner, Dr. Ivar Giaever resigned from the American Physical Society (APS) in protest over their non-scientific stance on global warming. Here is a video of a speech that Dr. Giaever gave at the 2015 Lindau Nobel Laureate Meetings where he delineates the misrepresentations that the alarmists, including Barack Obama, make in an attempt to sell their position to an unknowledgeable public. |
07-12-15 |
Dr. Ivar Giaever
YouTube |
|||||||||||||||||||||||||||||||||||||||||||||||||||||||||||||||||||
| 08-28-15 | Watts Up With That? | ||||||||||||||||||||||||||||||||||||||||||||||||||||||||||||||||||||
|
German scientists examined the earth's climate records for the past 2,500 years. Their findings: "The analysis of the past 2500 years involved data from tree rings, sediment cores, stalagmites, etc. A plot of the data yields a climate operating with cyclic behavior." "Compared to the maxima and minima of the past, the current minima and maxima show that there is nothing unusual happening today. The scientists say today's temperature changes are within the normal range. The German authors write: 'Especially the 20th century shows nothing out of the ordinary.'" [Emphasis added] "For better or worse, these scientists argue that global cooling is likely during the next 60 years." |
08-30-15 | PowerLine | |||||||||||||||||||||||||||||||||||||||||||||||||||||||||||||||||||
|
Dr. David Evans has posted a series of ten articles on Joanne Nova's website, discussing the mathematical errors inherent in the computerized climate models which have allowed climate alarmists to vastly overstate the impact of CO₂ on the planet's warming. The master link to these articles is given to the right and links to the specific articles will be included in the section. Here are excerpts from Dr. Evan's introduction to the series. "There is an intellectual standoff in climate change. Skeptics point to empirical evidence that disagrees with the climate models. Yet the climate scientists insist that their calculations showing a high sensitivity to carbon dioxide are correct — because they use well-established physics, such as spectroscopy, radiation physics, and adiabatic lapse rates. "How can well-accepted physics produce the wrong answer? We mapped out the architecture of their climate models and discovered that while the physics appears to be correct, the climate scientists applied it wrongly. Most of the projected warming comes from two specific mistakes. "Given all the empirical evidence against the carbon dioxide theory, there had to be problems in the basic sensitivity calculation. Now we've found them. "We are going to explain this and more in a series of blog posts." |
09-22-15 | Science Speak | |||||||||||||||||||||||||||||||||||||||||||||||||||||||||||||||||||
|
Just one example of how your tax dollars are being used to directly fund the political ideology of the climate change agenda. "Chairman of the House Committee on Space, Science and Technology, has written to Professor Jagadish Shukla of George Mason University, in Virginia, requesting that he release all relevant documents pertaining to his activities as head of a non-profit organization called the Institute of Global Environment And Society. "Smith has two main areas of concern. "First, the apparent engagement by the institute in 'partisan political activity' - which, as a non-profit, it is forbidden by law from doing. "Second, what precisely has the IGES institute done with the $63 million in taxpayer grants which it has received since 2001 and which appears to have resulted in remarkably little published research?" |
10-02-15 | Breitbart | |||||||||||||||||||||||||||||||||||||||||||||||||||||||||||||||||||
|
"A new study says that an increase in Antarctic snow accumulation that began 10,000 years ago is currently adding enough ice to the continent to outweigh the increased losses from its thinning glaciers. "The research challenges the conclusions of other studies, including the Intergovernmental Panel on Climate Change's (IPCC) 2013 report, which says that Antarctica is overall losing land ice. "According to the new analysis of satellite data, the Antarctic ice sheet showed a net gain of 112 billion tons of ice a year from 1992 to 2001. That net gain slowed to 82 billion tons of ice per year between 2003 and 2008." Of course, there is never any good news from our friends at NOAA or NASA that is not immediately hedged with a "possibility" of doom. Thus we are treated to the following future scenarios: "But it might only take a few decades for Antarctica's growth to reverse, according to Zwally. 'If the losses of the Antarctic Peninsula and parts of West Antarctica continue to increase at the same rate they've been increasing for the last two decades, the losses will catch up with the long-term gain in East Antarctica in 20 or 30 years — I don't think there will be enough snowfall increase to offset these losses.'" and "'The good news is that Antarctica is not currently contributing to sea level rise, but is taking 0.23 millimeters per year away,' Zwally said. 'But this is also bad news. If the 0.27 millimeters per year of sea level rise attributed to Antarctica in the IPCC report is not really coming from Antarctica, there must be some other contribution to sea level rise that is not accounted for.'" And so it goes. When it comes to global warming, it is "settled science" for which there can never be any actual evidence contradicting it's preordained conclusions — a condition that is more akin to religion than science. |
10-30-15 |
Science Daily NASA |
|||||||||||||||||||||||||||||||||||||||||||||||||||||||||||||||||||
|
Time for an update. Back on October 13, 2012 (see above), it was reported that there had been absolutely no global warming for the previous sixteen years. Now that period has been extended to eighteen years nine months! 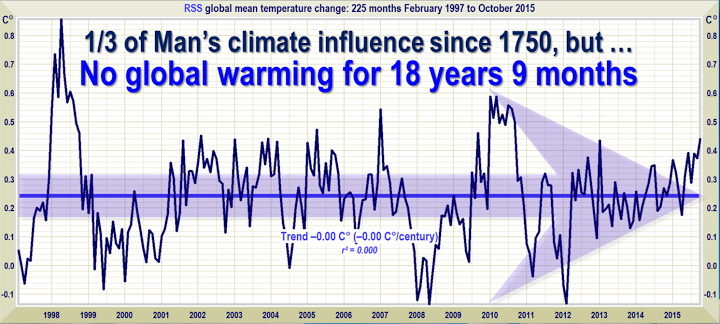 "The Pause lengthens yet again. One-third of Man's entire influence on climate since the Industrial Revolution has occurred since February 1997. Yet the 225 months since then show no global warming at all. With this month's RSS (Remote Sensing Systems satellite) temperature record, the Pause beats last month's record and now stands at 18 years 9 months." One might wonder just how long the factual data must fail to conform with the alarmists' climate models before the theory of man-caused global warming is considered invalidated? But that is only a question for science which deals in in testable hypotheses. The politicized global warming movement is anything but science as it is a theory -- in the minds of its proponents -- which is "settled" and is incapable of being invalidated, regardless of the actual facts. |
11-04-15 | Climate Depot | |||||||||||||||||||||||||||||||||||||||||||||||||||||||||||||||||||
|
The Journal of Hydrology reports on a new study from the Physics Department at York University, located in Toronto, Canada. The study looked at: "Precipitation measurements made at nearly 1000 stations located in 114 countries were studied. Each station had at least 100 years of observations resulting in a dataset comprising over 1.5 million monthly precipitation amounts. Data for some stations extend back to the 1700s although most of the data exist for the period after 1850. The total annual precipitation was found if all monthly data in a given year were present. The percentage annual precipitation change relative to 1961-90 was plotted for 6 continents; as well as for stations at different latitudes and those experiencing low, moderate and high annual precipitation totals." And here is a summary of the conclusions:
|
11-11-15 | Science Direct | |||||||||||||||||||||||||||||||||||||||||||||||||||||||||||||||||||
|
Reporting on research from the University of Exeter, a Science Daily article titled "Don't Forget Plankton in Climate Change Models" reports that phytoplankton (alga) rapidly evolve to tolerate varying water temperatures, and as temperatures increase, so does the efficiency of the plankton in absorbing and converting carbon dioxide into biomass. Quoting from the article: "The results show that evolutionary responses in phytoplankton to warming can be rapid and might offset some of the predicted declines in the ability of aquatic ecosystems to absorb carbon dioxide as the planet warms." "Our results demonstrate that evolutionary responses of phytoplankton to warming should be taken into account when developing models of how climate change will affect aquatic ecosystems." |
11-27-15 | Science Daily | |||||||||||||||||||||||||||||||||||||||||||||||||||||||||||||||||||
|
In a article titled, Quantification of the Diminishing Earth's Magnetic Dipole Intensity and Geomagnetic Activity as the Causal Source for Global Warming within the Oceans and Atmosphere, David A. E. Vares, Trevor N. Carniello and Michael A. Persinger demonstrate that there is a causal connection between the earth's shifting magnetic field and surface temperatures. They conclude: "These results indicated that the increase in CO2 and global temperatures are primarily caused by major geophysical factors, particularly the diminishing total geomagnetic field strength and increased geomagnetic activity, but not by human activities. Strategies for adapting to climate change because of these powerful variables may differ from those that assume exclusive anthropomorphic causes." |
01-29-16 | Int. J. of Geosciences | |||||||||||||||||||||||||||||||||||||||||||||||||||||||||||||||||||
|
In light of the new claims coming from NASA, NOAA and other sources that 2015 was the "warmest year on record," Dr. Tim Ball writes a retrospective piece where he reexamines the earth's actual historical records, once again placing current temperature data in proper perspective. His first major point is that by restricting the "data set" to just the past 120 years, a distorted picture of events is artificially created, where recent warming trends are then inaccurately ascribed to human activity rather than to natural processes. "Recent discussion about record weather events, such as the warmest year on record, is a totally misleading and scientifically useless exercise. This is especially true when restricted to the instrumental record that covers about 25% of the globe for at most 120 years. The age of the Earth is approximately 4.54 billion years, so the sample size is 0.000002643172%. Discussing the significance of anything in a 120-year record plays directly into the hands of those trying to say that the last 120-years climate is abnormal and all due to human activity. It is done purely for political propaganda, to narrow people's attention and to generate fear." After a bit more discussion, Bell presents this chart, developed from ice core samples from both Greenland and Antarctica, demonstrating that the recent earth warming is not unusual by fully consistent with long term natural cycles. 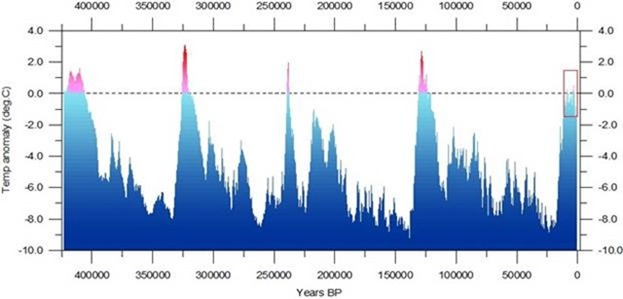 Continuing the discussion, Ball reviews other data, presented in a series of charts, demonstrating that the major claims of the IPCC are false. He concludes: "It is the misuse of science to create the deception that is the AGW claim that makes distraction, exaggeration and selective truths necessary. However, as Aldous Huxley said, 'Facts do not cease to exist because they are ignored.'" |
02-07-16 | Watts Up With That? | |||||||||||||||||||||||||||||||||||||||||||||||||||||||||||||||||||
|
Christopher Monckton, Willie Soon, and David Legates pose the following ten questions that expose the ideological agenda being driven by "money, fame and power" rather than scientific truth, which motivates the climate alarmists. Question #2 is particularly interesting. "1: What is the source of the warming that surface thermometer datasets now say has occurred in the past 18 years? 2: Why, just two years ago, did every surface temperature dataset agree with the satellites that there had been no global warming so far in this century? And why was every surface dataset altered in the two years preceding the Paris climate conference – in a manner calculated to show significant warming – even though the satellite records continue to show little or no warming? 3: Why do all the datasets, surface as well as satellite, show a lot less warming than predicted? Why has the rate of warming over the past quarter century been only one-third to one-half of the average prediction made by the UN's climate panel in its 1990 First Assessment Report, even after the numerous questionable adjustments to the surface temperature datasets? 4: Why is the gap between official over-prediction and observed reality getting wider? 5: Why is the gap widening between warming rates measured by satellite and by surface datasets? 6: Why should anyone invest trillions of dollars – to replace fossil fuels with expensive renewable energy – on the basis of official predictions in 1990 and 2001 that differ so greatly from reality? 7: Why has the observed rate of warming, on all datasets, been tumbling for decades notwithstanding predictions that it would at least remain stable? 8: So, where is the tropical upper-air hot-spot? 9: Why, if CO2-driven warming ought to warm the surface ocean first, is the ocean warming from below? And why has the ocean been warming throughout the eleven full years of the ARGO dataset at a rate equivalent to only 1 degree every 430 years? 10: Given that the authors of the largest-ever survey of peer-reviewed opinion in learned papers found that only 64 of 11,944 papers (0.5% of the total) actually said their authors agreed with the official "consensus" proposition that recent warming was mostly manmade – on what rational, evidence-based, scientific ground is it daily asserted that "97% of scientists" believe recent global warming is not only manmade but dangerous?" The article expands upon each of these question, providing a fuller indication of the impact raised by each. |
02-10-16 | Watts Up With That? | |||||||||||||||||||||||||||||||||||||||||||||||||||||||||||||||||||
|
Dr. David Evans and Joanne Nova write about errors made in climate computer models which have improperly accounted for heat transfer in the upper atmosphere, resulting in a five to ten fold overestimate of the warming that can be attributable to atmospheric carbon dioxide. "The scientists who believe in the carbon dioxide theory of global warming do so essentially because of the application of 'basic physics' to climate, by a model that is ubiquitous and traditional in climate science. This model is rarely named, but is sometimes referred to as the 'forcing-feedback framework/paradigm.' Explicitly called the 'forcing-feedback model' (FFM) here, this pen-and-paper model estimates the sensitivity of the global temperature to increasing carbon dioxide. "The FFM has serious architectural errors. It contains crucial features dating back to the very first model in 1896, when the greenhouse effect was not properly understood. Fixing the architecture, while keeping the physics, shows that future warming due to increasing carbon dioxide will be a fifth to a tenth of current official estimates. Less than 20% of the global warming since 1973 was due to increasing carbon dioxide." |
02-17-16 | Science Speak | |||||||||||||||||||||||||||||||||||||||||||||||||||||||||||||||||||
|
In the Journal of Geography and Natural Disasters, Kelly MJ, from the Department of Engineering at the University of Cambridge, has published a report titled, Trends in Extreme Weather Events since 1900 — Conundrum for Wise Polity Advice [PDF], which analyses weather data from the past century and observes: "It is widely promulgated and believed that human-caused global warming comes with increases in both the intensity and frequency of extreme weather events. A survey of official weather sites and the scientific literature provides strong evidence that the first half of the 20th century had more extreme weather than the second half, when anthropogenic global warming is claimed to have been mainly responsible for observed climate change. The disconnect between real-world historical data on the 100 years' time scale and the current predictions provides a real conundrum when any engineer tries to make a professional assessment of the real future value of any infrastructure project which aims to mitigate or adapt to climate change. What is the appropriate basis on which to make judgements when theory and data are in such disagreement?" He then concludes, from an engineering perspective: "The lack of clarity about future extreme weather, after 20 years of intensive analysis of future climates is deeply worrying. There is nothing that emerges from references [1,2] that would require a significant refinement of the margins that have applied over the last half-century, and hyperbole is no substitute for hard facts in the engineering of the physical infrastructure. Over-adaptation that is not needed leaves clients free to sue advisors if the problems have been oversold and the costs of protection prove to have been excessive, even on a 20-year basis." |
02-17-16 | Journal of Geography | |||||||||||||||||||||||||||||||||||||||||||||||||||||||||||||||||||
|
Martin Hertzberg, a meteorologist and chemist, and Hans Schreuder, an analytical chemist, have authored a paper titled, Reassessing the Climate Role of Carbon Dioxide [PDF], which summarizes many of the criticisms that have been leveled against the IPCC's conclusions that earth's warming is primarily a causal result of atmospheric CO₂. It concludes: "Nothing in the data supports the supposition that atmospheric CO2 is a driver of weather or climate, or that human emissions control atmospheric CO2. Furthermore, CO2 is not a pollutant, but an essential ingredient of the Earth's ecosystem on which almost all life depends via photosynthesis. This paper rejects the new paradigm of "climate science" and asserts that the traditional, century old meteorological concepts for the factors that control weather and climate remain sound but need to be reassessed." |
03-21-16 | Hertzberg & Schreuder | |||||||||||||||||||||||||||||||||||||||||||||||||||||||||||||||||||
|
Bob Tisdale posts an update regarding the recent NOAA revisions to the temperature data; changes made in order to conceal the current 20 year pause in global temperature increases by lowering the preceding data. The article is filled with links to related posts and presents corroborating data. |
05-15-16 | Watts Up With That? | |||||||||||||||||||||||||||||||||||||||||||||||||||||||||||||||||||
|
Steven Capozzola provides another look at the the Big Lie that states, "97% of scientists believe in global warming". Here, he provides links to the original research and abstract which state: "We find that 66.4% of abstracts expressed no position on AGW, 32.6% endorsed AGW, 0.7% rejected AGW and 0.3% were uncertain about the cause of global warming. Among abstracts expressing a position on AGW, 97.1% endorsed the consensus position that humans are causing global warming." [Emphasis added] So the truth is that only 31.6% (i.e., 97.1% of 32.6%) of the original 11,944 papers examined expressed a belief that human activity was warming the planet. And there is no analysis of the severity of the impact expressed in those papers which could range from trivial to catastrophic. Therefore, not only is the 97% consensus mantra a Big Lie, the entire research behind it is nothing more than pure unscientific propaganda. |
05-20-16 | Climate Chg. Dispatch | |||||||||||||||||||||||||||||||||||||||||||||||||||||||||||||||||||
|
Does anyone still think the environmental movement and the global warming hoax is actually about the environment rather than asserting totalitarian control over all human thought and activity? "A basic fact about agricultural products such as grains and oilseeds is that the carbon in them, called biogenic carbon, came from the atmosphere. Biogenic carbon will return to the atmosphere when these products are consumed, such as when human beings eat bread and then breathe out the carbon dioxide resulting from the breakdown of bread in the body. Biogenic carbon therefore cannot contribute to climate change." "The EPA intends to penalize American farmers and those who make modern energy and bioproducts such as plastics from agricultural feedstocks by treating biogenic carbon like fossil carbon. As part of its approach, the EPA is now attempting to regulate 'sustainability' in the farm field." "The EPA is trying to put itself in charge of regulating farms—an outstanding example of 'mission creep' and bureaucratic overreach." "America's farmers and the consumers of what they produce would be collateral damage of the EPA's misguided plans." Notice that, regardless of the evidence of action after action after action that reveals the true intent, people never ceasing to extend the benefit of the doubt to the bureaucrats and politicians who force their control upon productive people. There is nothing "misguided" about these plans. They are laser-targeted towards achieving the precise results we can clearly see them achieving. |
07-10-16 | Wall Street Journal | |||||||||||||||||||||||||||||||||||||||||||||||||||||||||||||||||||
|
Dr. Tim Ball writes about how the public's perception of catastrophic manmade climate change is manufactured to a large degree by press coverage. "One phenomenon that creates the illusion weather is abnormal is the attention given by the media. We all experience being introduced to a person then seeing them pop up every time we turn around. It's the same thing with cars after you buy one you see them everywhere. In both cases they were always there, but not part of your awareness. Weather and climate events seem to occur everyday, but it is because they became a media story. They always occurred. Now the story appears and is amplified by the sensationalism of the media with their 'Extreme Weather Reports.'" He goes on to discuss the public's general ignorance regarding both weather and climate, which leaves them susceptible to false impressions and outright misrepresentations. As an example, he provides the following graph which shows the historical northern hemisphere temperature record over the past 10,000 years, as recorded in the Greenland ice. 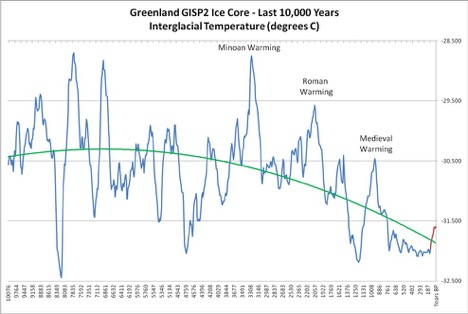 "The current temperature is on the right (red line) Some salient points that expose the lies and distortions;
Read the entire article. |
08-01-16 | The Rebel | |||||||||||||||||||||||||||||||||||||||||||||||||||||||||||||||||||
|
New research suggests that the solar activity cycle for the next three cycles (33 years) may be significantly below normal, leading to significant global cooling. The researcher, Professor Valentina Zharkova, states: "We will see it from 2020 to 2053, when the three next cycles will be very reduced magnetic field of the sun. Basically what happens is these two waves, they separate into the opposite hemispheres and they will not be interacting with each other, which means that resulting magnetic field will drop dramatically nearly to zero. And this will be a similar conditions like in Maunder Minimum. "What will happen to the Earth remains to be seen and predicted because nobody has developed any program or any models of terrestrial response – they are based on this period when the sun has maximum activity — when the sun has these nice fluctuations, and its magnetic field [is] very strong. But we're approaching to the stage when the magnetic field of the sun is going to be very, very small." "Whatever we do to the planet, if everything is done only by the sun, then the temperature should drop similar like it was in the Maunder Minimum. At least in the Northern hemisphere, where this temperature is well protocoled and written. We didn't have many measurements in the Southern hemisphere, we don't know what will happen with that, but in the Northern hemisphere, we know it's very well protocoled. The rivers are frozen. There are winters and no summers, and so on. "So we only hope because these Maunder Minima will be shorter, the Maunder Minimum of the 17th century was about 65 years, the Maunder Minimum which we expect will be lasting not longer than 30-35 years." |
08-09-16 | Watts Up With That? | |||||||||||||||||||||||||||||||||||||||||||||||||||||||||||||||||||
|
In an essay titled, How To Tell Who's Lying To You: Climate Science Edition, Francis Menton discusses the methodology that can be used in order to determining who is and is not being truthful in the presentation of facts and conclusions regarding the scientific debate over Anthropogenic Global Warming. |
09-22-16 | Manhattan Contrarian | |||||||||||||||||||||||||||||||||||||||||||||||||||||||||||||||||||
|
Whoops, another in a long line of alarmist climate predictions bites the dust. "Dire predictions that the Arctic would be free of sea ice by September have proven unfounded after satellite images showed there is far more ice now than in 2012. "Scientists including Peter Wadhams, of Cambridge University, and Wieslaw Maslowski, of the Naval Postgraduate School in Moderey, California, have regularly forecast the loss of ice by 2016, a warning that has been widely reported by the BBC and other media outlets. "Prof Wadhams, who is considered a leading expert on Arctic sea ice loss, has recently published a book entitled A Farewell To Ice in which he repeated the assertion that the Arctic would be free of ice in the middle of this decade. "As late as this summer he was still predicting an ice-free September. "Yet when figures were released for the yearly minimum on Sept 10, they showed that there was still 4.14 million sq km of sea ice, which was 21 per cent more than the lowest point in 2012." Oh well, you can't be right all of the time. But Prof Wadhams is no quitter and doubles down on his failed predictions. "'My view is that the trend of summer sea ice volume is relentlessly downward, such that the volume (and thus area) will come to a low value very soon - in a very small number of years,' "He said. 'This is to be contrasted with some of the bizarre predictions made by computer modellers, who have the summer sea ice remaining until late this century, which is quite impossible.'" Impossible indeed! |
10-08-16 | National Post | |||||||||||||||||||||||||||||||||||||||||||||||||||||||||||||||||||
|
In the essay Solar Cycle Mystery Solved by David Archibald, the solar sunspot cycle is explained in terms of the orbit of the larger planets in the solar system along with the resulting effect upon the Earth's climate. 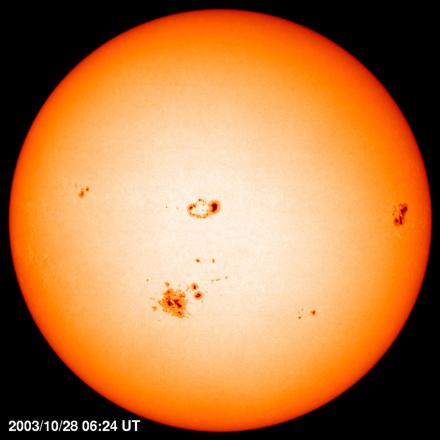 |
10-13-16 | Watts Up With That? | |||||||||||||||||||||||||||||||||||||||||||||||||||||||||||||||||||
|
Here is some interesting information from Bjorn Lomborg, director of the Copenhagen Consensus Center, regarding the "disappearing" Pacific islands. "Using historic aerial photographs and high-resolution satellite imagery, Auckland University scientists Murray Ford and Paul Kench recently analyzed shoreline changes on six atolls and two mid-ocean reef islands in the Marshall Islands. Their peer-reviewed study, published in the September 2015 issue of Anthropocene, revealed that since the middle of the 20th century the total land area of the islands has actually grown. "How is that possible? It seems self-evident that rising sea levels will reduce land area. However, there is a process of accretion, where coral broken up by the waves washes up on these low-lying islands as sand, counteracting the reduction in land mass. Research shows that this process is overpowering the erosion from sea-level rise, leading to net land-area gain." [...] "My [Lomborg's] peer-reviewed research, published last November in the journal Global Policy, shows that even if every nation were to fulfill all their carbon-cutting promises by 2030 and stick to them all the way through the century--at a cost of more than $100 trillion in lost GDP—global temperature rise would be reduced by a tiny 0.3°F (0.17°C)." |
10-13-16 | Wall Street Journal | |||||||||||||||||||||||||||||||||||||||||||||||||||||||||||||||||||
|
Dr. Judith Curry resigned from her tenured faculty position at the Georgia Institute of Technology. In a blog post explaining her decision, she makes the following comments: "A deciding factor was that I no longer know what to say to students and postdocs regarding how to navigate the CRAZINESS in the field of climate science. Research and other professional activities are professionally rewarded only if they are channeled in certain directions approved by a politicized academic establishment — funding, ease of getting your papers published, getting hired in prestigious positions, appointments to prestigious committees and boards, professional recognition, etc. "How young scientists are to navigate all this is beyond me, and it often becomes a battle of scientific integrity versus career suicide (I have worked through these issues with a number of skeptical young scientists)." |
01-03-17 | Climate Etc. | |||||||||||||||||||||||||||||||||||||||||||||||||||||||||||||||||||
|
More information concerning the high correlation between solar activity and the earth's temperature continues to emerge. In this article, Kenneth Richard states:
"[S]olar scientists are continuing to advance our understanding of
solar activity and its effect on the Earth system, and their
results are progressively suggestive of robust correlations
between solar variability and climate changes.
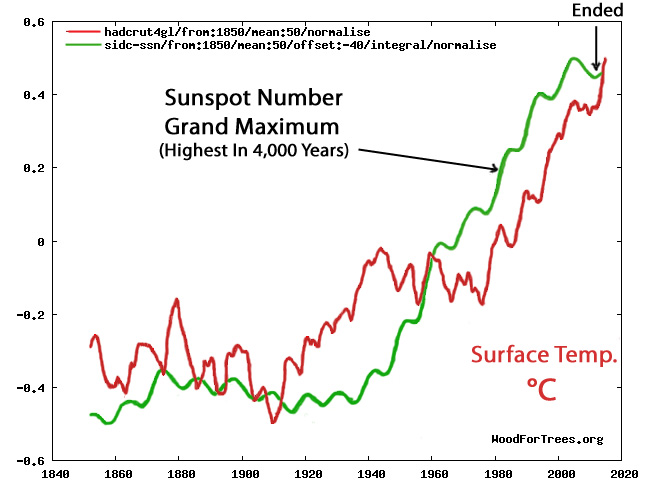 Citing one paper authored by Harald Yndestad and Jan-Erik Solheim, they conclude: "Deterministic models based on the stationary periods confirm the results through a close relation to known long solar minima since 1000 A.D. and suggest a modern maximum period from 1940 to 2015. The model computes a new Dalton-type sunspot minimum from approximately 2025 to 2050 and a new Dalton-type period TSI minimum from approximately 2040 to 2065. ... Periods with few sunspots are associated with low solar activity and cold climate periods. Periods with many sunspots are associated with high solar activity and warm climate periods." |
01-12-17 | NoTrickZone | |||||||||||||||||||||||||||||||||||||||||||||||||||||||||||||||||||
|
Government agencies, along with the media, have loudly been claiming that, once again, 2016 was "the hottest year on record." Robert Tracinski wondered why the New York Times wasn't reporting any hard numbers to back up this claim and went looking for answers. Here is what he found:
"It wasn't just the New York Times. Try finding the relevant
numbers ready at hand in the NASA/NOAA press
release. You get numbers comparing 2016's temperature with
'the mid-20th century mean' or 'the late 19th century.' But
there's nothing comparing it to last year or the year before
except qualitative descriptions. So the government's science
bureaucracy is setting the trend, making reporters dig for the
relevant numbers rather than presenting them up front.
This is how the game is played. It is left to each truth-seeking individual to investigate the facts for themselves and not simply swallow the propaganda being manufactured. </p> |
01-18-17 | The Federalist | |||||||||||||||||||||||||||||||||||||||||||||||||||||||||||||||||||
|
In a new study from Brown University, researchers have found a link between the earth's orbital period and the growth/reduction of sea ice in the southern hemisphere. From the article: "Climate simulations show how changes in Earth's orbit alter the distribution of sea ice on the planet, helping to set the pace for the glacial cycle. "Earth is currently in what climatologists call an interglacial period, a warm pulse between long, cold ice ages when glaciers dominate our planet's higher latitudes. For the past million years, these glacial-interglacial cycles have repeated roughly on a 100,000-year cycle. Now a team of Brown University researchers has a new explanation for that timing and why the cycle was different before a million years ago. "Using a set of computer simulations, the researchers show that two periodic variations in Earth's orbit combine on a 100,000-year cycle to cause an expansion of sea ice in the Southern Hemisphere. Compared to open ocean waters, that ice reflects more of the sun's rays back into space, substantially reducing the amount of solar energy the planet absorbs. As a result, global temperature cools. "'The 100,000-year pace of glacial-interglacial periods has been difficult to explain,' said Jung-Eun Lee, an assistant professor in Brown's Department of Earth, Environmental and Planetary Studies and the study's lead author. 'What we were able to show is the importance of sea ice in the Southern Hemisphere along with orbital forcings in setting the pace for the glacial-interglacial cycle." |
01-26-17 | Brown University | |||||||||||||||||||||||||||||||||||||||||||||||||||||||||||||||||||
|
In an article titled Exposed: How World Leaders Were Duped Into Investing Billions Over Manipulated Global Warming Data, David Rose states: "A high-level whistleblower has told this newspaper that America's National Oceanic and Atmospheric Administration (NOAA) breached its own rules on scientific integrity when it published the sensational but flawed report, aimed at making the maximum possible impact on world leaders including Barack Obama and David Cameron at the UN climate conference in Paris in 2015. "The report claimed that the 'pause' or 'slowdown' in global warming in the period since 1998 – revealed by UN scientists in 2013 – never existed, and that world temperatures had been rising faster than scientists expected. Launched by NOAA with a public relations fanfare, it was splashed across the world's media, and cited repeatedly by politicians and policy makers. "But the whistleblower, Dr John Bates, a top NOAA scientist with an impeccable reputation, has shown The Mail on Sunday irrefutable evidence that the paper was based on misleading, 'unverified' data. "It was never subjected to NOAA's rigorous internal evaluation process - which Dr Bates devised." Here are some additional snippets from the report: "The scandal has disturbing echoes of the 'Climategate' affair ... Both datasets were flawed. ... used unreliable methods which overstated the speed of warming. ... The land temperature dataset used by the study was afflicted by devastating bugs in its software ... The paper relied on a preliminary, 'alpha' version of the data which was never approved or verified." Read the entire article for the full story. At the Climate Etc. website, John Bates gives a much more detailed account of the manipulations in an article titled Climate Scientists Versus Climate Data". |
02-04-17 | Daily Mail | |||||||||||||||||||||||||||||||||||||||||||||||||||||||||||||||||||
|
In the wake of the revelations from NOAA scientist John Bates (see previous item above). Dr. Tim Ball writes a very good article on the corrupting influence that bureaucratic politics has on true science. The entire article is well worth reading. Here are a few excerpts: "Many jumped to the defense of Dr. John Bates, the former NOAA employee who waited until he retired to disclose malfeasance in the science and management at that agency. Bates claimed he told his bosses about the problem but said they effectively ignored him. [...] All sorts of lame excuses were made for Bates, perhaps the only one with limited merit was that his disclosure was better late than never. The problem is he and his supporters can't have it both ways. He can't be a knowledgeable climate scientist doing valuable work, when what he and all the others around him were doing was corrupted, unquestioning, naive, limited, political science" "The most obvious answer is that being a scientist and a bureaucrat are mutually exclusive." "Walter Gilbert said, 'The virtues of science are skepticism and independence of thought.' Both are anathema to bureaucracies. There is a larger explanation that encompasses and limits all current understanding, not just science." "The Bates event is a symptom of a much wider problem. It is much more than just the fear of speaking out about malfeasance in the workplace. It is more than the problem of bureaucrats doing science or people using science for a political agenda. All those exist and require attention. However, they mask the larger problems of our inability to describe, understand, and advance in a generalist world that has developed a research structure that glorifies specialists who know a great deal about a minuscule piece but don't even know where it fits in the larger picture." |
02-20-17 | Watts Up With That? | |||||||||||||||||||||||||||||||||||||||||||||||||||||||||||||||||||
|
A new research paper shows that the previously 1979-1997 warming of 0.32°C for one section of Antarctica has now reversed, showing an even larger 1999-2014 -0.47°C cooling. Quoting from the paper's abstract: "The Antarctic Peninsula (AP) is often described as a region with one of the largest warming trends on Earth since the 1950s, based on the temperature trend of 0.54°C/decade during 1951-2011 recorded at Faraday/Vernadsky station. Accordingly, most works describing the evolution of the natural systems in the AP region cite this extreme trend as the underlying cause of their observed changes. However, a recent analysis (Turner et al., 2016) has shown that the regionally stacked temperature record for the last three decades has shifted from a warming trend of 0.32°C/decade during 1979-1997 to a cooling trend of -0.47°C/decade during 1999-2014. While that study focuses on the period 1979-2014, averaging the data over the entire AP region, we here update and re-assess the spatially-distributed temperature trends and inter-decadal variability from 1950 to 2015, using data from ten stations distributed across the AP region. We show that Faraday/Vernadsky warming trend is an extreme case, circa twice those of the long-term records from other parts of the northern AP. Our results also indicate that the cooling initiated in 1998/1999 has been most significant in the N and NE of the AP and the South Shetland Islands (> 0.5°C between the two last decades), modest in the Orkney Islands, and absent in the SW of the AP. This recent cooling has already impacted the cryosphere in the northern AP, including slow-down of glacier recession, a shift to surface mass gains of the peripheral glacier and a thinning of the active layer of permafrost in northern AP islands." |
04-27-17 | Watts Up With That? | |||||||||||||||||||||||||||||||||||||||||||||||||||||||||||||||||||
|
The Economist recently published two articles titled: The Thawing Arctic Threatens an Environmental Catastrophe As the Arctic Melts the World's Weather Suffers. This is some scary stuff ... until you look a bit closer, as Patrick Michaels of the Cato Institute did, and then reported on in the article, What The Economist Didn't Tell You about Greenland's Ice. The Economist stated: "The most worrying changes are happening in Greenland, which lost an average of 375bn tonnes of ice per year between 2011 and 2014" "This is equivalent of over 400 massive icebergs measuring 1km on each side disappearing each year." to which Michaels responds: "This is a finely selected cherry that The Economist plucked, 2012 was an exceedingly warm year averaged of the island-continent. Had they included all the recent data, they would have shown that accumulation of ice on Greenland recently reached a record high compared to the previous three decades:"  "At the turn of this century, the U.S. Geological Survey reported the volume of Greenland's ice at 2,600,000km. The maximum melt of 400km is a grand total of 1/5000th of its ice." There's more. Read the article for the details. It's just business as usual. This lying by omission of the relevant facts demonstrates just one of the tools in the bag of tricks employed by those who are driven by the politicization of climate "science" in order to fabricate a justification for imposing an ever widening net of controls over everyone. |
05-02-17 | Cato Institute | |||||||||||||||||||||||||||||||||||||||||||||||||||||||||||||||||||
|
This article provides a very calm and reasoned summarization of many of the facts covered above. It makes a good introductory article to pass along to someone who needs a quick overview of the issues. |
06-05-17 | Objsci | |||||||||||||||||||||||||||||||||||||||||||||||||||||||||||||||||||
|
In an article titled Research Team Slams Global Warming Data In New Report, Zerohedge discusses a new peer reviewed report that concludes that the National Oceanic and Atmospheric Administration (NOAA), National Aeronautics and Space Administration (NASA), and the UK's Hadley Centre for Climate Prediction and Research (HADLEY) have all been artificially adjusting raw surface air temperature readings. As the report authors state it: "Clearly the historical GAST [Global Average Surface Temperature] data adjustments that have been made have been dramatic and invariably have been favorable to Climate Alarmists' views regarding Global Warming. The question now is whether the latest versions of GAST data by NOAA, NASA and Hadley are credible for policy analysis, or even climate modeling, purposes." An analysis of the datasets is then made, resulting in these observations: "While the notion that some 'adjustments' to historical data might need to be made is not challenged, logically it would be expected that such historical temperature data adjustments would sometimes raise these temperatures, and sometimes lower them. This situation would mean that the impact of such adjustments on the temperature trend line slope is uncertain. However, each new version of GAST has nearly always exhibited a steeper warming linear trend over its entire history. "That was accomplished by systematically removing the previously existing cyclical temperature pattern. This was true for all three entities providing GAST data measurement, NOAA, NASA and Hadley CRU." All of which leads to the conclusion: "The conclusive findings of this research are that the three GAST data sets are not a valid representation of reality. In fact, the magnitude of their historical data adjustments, that removed their cyclical temperature patterns, are totally inconsistent with published and credible U.S. and other temperature data. Thus, it is impossible to conclude from the three published GAST data sets that recent years have been the warmest ever –despite current claims of record setting warming. "Finally, since GAST data set validity is a necessary condition for EPA's GHG/CO2 Endangerment Finding, it too is invalidated by these research findings." Here is a link to the full report [PDF]: |
07-15-17 | Zerohedge | |||||||||||||||||||||||||||||||||||||||||||||||||||||||||||||||||||
|
Another in a long history of government agencies—Australia this time—manipulating their temberature data in order to manufacture increased warming trends. Quoting excerpts from the article:
"Meteorologist Lance Pidgeon watched the 13 degrees Fahrenheit
Goulburn recording from July 2 disappear from the bureau's
website. The temperature readings fluctuated briefly and then
disappeared from the government's website.
|
07-31-17 | The Daily Caller | |||||||||||||||||||||||||||||||||||||||||||||||||||||||||||||||||||
|
As reported above here, here, here, here, here, here and here, numerous studies have analyzed the solar cycles and concluded that the earth may actually be headed for a cooling rather than warming period. Two German scientists, Horst-Joachim Ludecke and Carl-Otto Weiss, who previously reported on their solar analysis here, have now published their findings in The Open Atmospheric Science Journal. Quoting from the introduction: "Periodic or cyclic behaviour is so common in nature and physics that it gives the analysis technique of Fourier transform its outstanding importance. The reason for the abundance of cycles lies in the property of the transition from static to dynamic behaviour. This 'modulational instability' occurs in space and time when the energy input into a dissipative system is increased beyond the range of static stability. It leads overwhelmingly to a periodic state (rare exceptions exist, e.g. the Lorenz model, where the onset of dynamics is chaotic). The Sun and the Earth are classic dissipative systems with energy input. Cyclic dynamics is therefore to be expected. Cycles with periods ranging from several years to more than 100,000 years have accordingly been observed, e.g. in paleoclimate studies." And from the conclusion: "We note that the temperature increase of the late 19th and 20th century is represented by the harmonic temperature representation, and thus is of pure multiperiodic nature. It can be expected that the periodicity of G7, lasting 2000 years so far, will persist also for the foreseeable future. It predicts a temperature drop from present to AD 2050, a slight rise from 2050 to 2130, and a further drop from AD 2130 to 2200." |
08-01-17 | TOASCJ | |||||||||||||||||||||||||||||||||||||||||||||||||||||||||||||||||||
|
Just another example in a long list showing that the computerized climate models are not providing us with new insights, let alone accurate forecasts. In a report titled, $127 Million Climate Supercomputer No Better Than 'Using A Piece Of Paper'", Dr. David Whitehouse, a former BBC science editor, reported that the computer models didn't: "give any better information than what could be obtained using a piece of paper." and then demonstrated how a simple review of the historical record showed that: "The risk of monthly rainfall exceeding the monthly record in the Southeast of England has not risen, contrary to many claims," and that the: "Met Office computer models do not give any more reliable insight than the historical data." |
08-04-17 | Watts Up With That? | |||||||||||||||||||||||||||||||||||||||||||||||||||||||||||||||||||
|
Analysis Says NOAA Global Temperature Data 'Doesn't Constitute A "Smoking Gun" For Global Warming' physicist Mikhail Voloshin discusses statistical methodology indicating that the climate data used by the National Oceanic and Atmospheric Administration (NOAA) fails to demonstrate any sort of significant warming trend that can be conclusive linked to external causal factors, and might be nothing more than a random walk or Brownian motion in the data set itself. Quoting a few excerpts from the article: "The global temperature record doesn't demonstrate an upward trend. It doesn't demonstrate a lack of upward trend either. Temperature readings today are about 0.75°C higher than they were when measurement began in 1880, but you can't always slap a trendline onto a graph and declare, "See? It's rising!" Often what you think is a pattern is actually just Brownian motion. When the global temperature record is tested against a hypothesis of random drift, the data fails to rule out the hypothesis. This doesn't mean that there isn't an upward trend, but it does mean that the global temperature record can be explained by simply assuming a random walk." "My study doesn't address the quality of the underlying data, nor the "massaging" that the NOAA performs on its raw instrument records in order to produce a single numerical value every year representing the global mean temperature anomaly (more on that later). What my study does address is to ask, even given the NOAA's own year-over-year numbers: Do those numbers actually represent an upward trend at all?" "Now, when it comes to the Earth's mean temperature, the simplest and most basic assumption, i.e. the null hypothesis, is the same as the null hypothesis for any other time series: that it behaves as a Markov process – specifically, a sub-type called a Martingale. What this means, quite simply, is that it has no "memory" outside of its immediate state – and that the single best predictor of any given year's temperature is the temperature that came before it. [...] To drive this point home, check out these sample runs of a randomly generated simulation of a temperature sequence, intended to mimic the NOAA's annual temperature anomaly records since 1880." 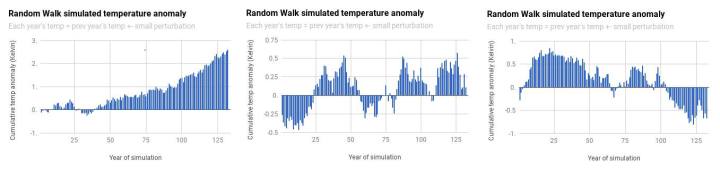 "The key takeaway is that one cannot merely look at a graph of historical data, slap a trendline on it, and then assert that there's some underlying force that's propelling that trend." Voloshin goes on to discuss the adjustments that NOAA makes to its data, rendering it unreliable, and then looks at the question of how known statistical error is handled. "So the question is: how do the climatologists that crunch these numbers, in fact, handle the error bars? Well, not to get into a lengthy digression on the topic, but suffice it to say that I've examined and experimented with their data processing code. Not from the NOAA/NCDC specifically, but from NASA's Goddard Institute for Space Studies (GISS), which compiles a surface temperature analysis called GISTEMP that is then used by organizations such as the NOAA. [...] How do they handle error bars? Simple: they don't." Read the entire article as there is much more contained there. Voloshin sums things up: "The point of this discussion, therefore, is to emphasize that, when it comes to temperature anomaly data, Occam's Razor suggests that the year-over-year time series is a random walk. The burden of proof is on those claiming that there is a trend to the time series, that the "walk" isn't random. This burden can be met by showing that the data exhibits statistical properties that would be extremely unlikely for a purely random data set. [...] But I do need to add this caveat: The data doesn't disprove a trend either. The purpose of this analysis is merely to establish that it is well within reason to believe that the 130-year global temperature anomaly record is the result of a random walk, rather than a forced physical phenomenon; i.e. that a random walk can produce the temperature record as we've observed it." |
10-01-17 | Watts Up With That? | |||||||||||||||||||||||||||||||||||||||||||||||||||||||||||||||||||
|
In what is being called "Tidalgate," two Australian scientists have shown that data from sea level gauges in the Indian Ocean have been manipulated by the databank "gatekeepers," Permanent Service for Mean Sea Level (PSMSL). 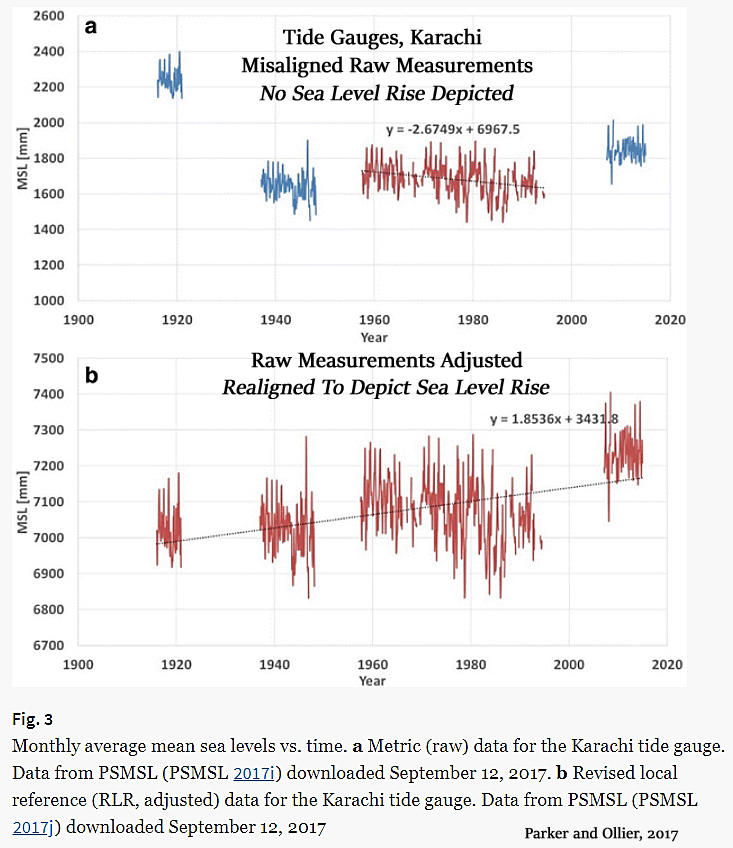 "The authors expose how PSMSL data-adjusters make it appear that stable sea levels can be rendered to look like they are nonetheless rising at an accelerated pace. The data-adjusters take misaligned and incomplete sea level data from tide gauges that show no sea level rise (or even a falling trend). Then, they subjectively and arbitrarily cobble them together, or realign them. In each case assessed, PSMSL data-adjusters lower the earlier misaligned rates and raise the more recent measurements. By doing so, they concoct a new linearly-rising trend." "The authors do not mince their words. They refer to these adjustments as 'highly questionable' and 'suspicious.' That's because they can find no plausible scientific explanation for the adjustments." "So there is nothing per se wrong with PSMSL making adjustments in order to make the different datasets align. What is wrong is the way that the scientists at PSMSL have adjusted them. In every case, they have revised them in order to make them produce a sharp upward trend in sea level rise – despite the fact that global records do not support this. The truth, Parker and Ollier conclude in their paper, is that sea level has changed very little in the three sites examined." |
12-06-17 | Breitbart | |||||||||||||||||||||||||||||||||||||||||||||||||||||||||||||||||||
|
At Real Climate Science, Tony Heller reports more details regarding how the National Oceanic and Atmospheric Administration (NOAA) has manipulated the data from the United States Historical Climatology Network (USHCN) weather stations in order to create a false accelerating warming trend of 2.5° C between 1895 and today. Heller points out that:
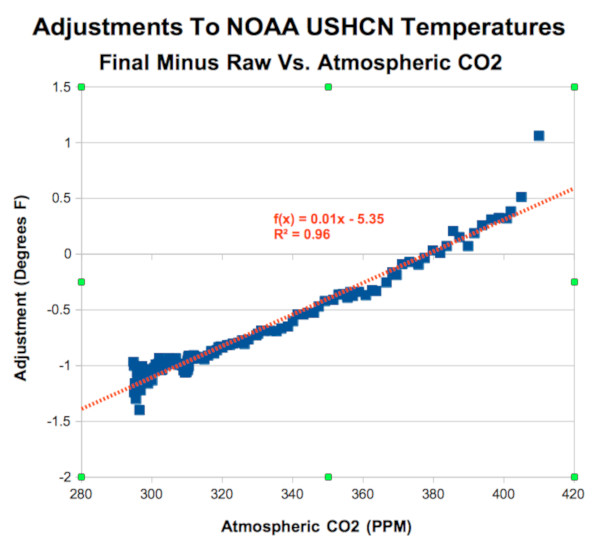 Read the full article for more details. |
03-20-18 | Real Climate | |||||||||||||||||||||||||||||||||||||||||||||||||||||||||||||||||||
|
Kenneth Richard has been monitoring various climate-related publications and has assembled a set of 46 recent graphs published in in 2018, showing that Nothing Climatically Unusual Is Happening. These publications — all referenced through links — examine global temperatures from many regions and from many perspectives. The conclusion is that there is no 20th–21st century warming occurring that is abnormal when the historic temperature record is properly examined. |
03-22-18 | No Trick Zone | |||||||||||||||||||||||||||||||||||||||||||||||||||||||||||||||||||
|
The Danish physical geographer Ole Humlum and the Global Warming Policy Foundation have released the report: State of the Climate 2017 (PDF). The executive summary from the report follows, with certain key points shown on bold, for emphasis.
Executive Summary
Read the entire 47 page report for the details. |
03-27-18 | GWPF Report 30 (PDF) | |||||||||||||||||||||||||||||||||||||||||||||||||||||||||||||||||||
|
The Engineer, Julius Sanks, published an article titled, Can Humans Melt the Antarctic Icecap?, in which he looks at the specific energy requirements that would be necessary in order to melt polar ice. He starts out by quoting Eric Holthaus from an 11-21-17 article titled, Ice Apocalypse: "The glaciers of Pine Island Bay are two of the largest and fastest-melting in Antarctica. (A Rolling Stone feature earlier this year dubbed Thwaites "The Doomsday Glacier.") Together, they act as a plug holding back enough ice to pour 11 feet of sea-level rise into the world's oceans — an amount that would submerge every coastal city on the planet. ... All this could play out in a mere 20 to 50 years—much too quickly for humanity to adapt." Sanks decided to look at just how much energy would actually be required to melt enough ice to raise the ocean level by 11 feet or 3.353 meters. With some simple math he shows that to raise the water level by that amount would require 361.8 Km3 of additional water, which means the melting of 1.32x10⁶ Km3 of ice which would require 4.05x10²³ Joules of heat energy, all delivered directly to the Antarctic ice. He then observes:
"It should be noted the Antarctic ice sheet is only 2.74 percent
of the planet's surface. If human output excites the atmosphere
evenly, a reasonable consideration is only that percentage of
energy is directly acting on the ice. But let's attack the
problem more directly.
The point is that many of the claims of those predicting environmental apocalypse cannot stand up to even the most rudimentary examination using concepts of basic physics, and the claim that man's activity is having significant impact upon the world in the face of the magnitude of energy represented by natural forces makes no sense. Postscript: For clarity, it should be pointed out that those driving the Global Warming narrative are not arguing that human activity is directly producing the heat that they say is warming the planet, but instead are saying that man is engaging in activity, such as CO₂ production, which is retaining heat while also producing a multiplying effect. To fully appreciate the point being made in this article, it is necessary to integrate it with other reports (see above) which indicate that there has not been any significant planetary warming over the past two decades (confirmed by satellite measurements) and that the temperature variations we have seen in the 20th and 21st century are well within those observed in the historical record. This article simply highlights the magnitude of the energy budget that would be required in order to effect the planetary changes being discussed and places human activity in perspective. |
04-16-18 | Watts Up With That? | |||||||||||||||||||||||||||||||||||||||||||||||||||||||||||||||||||
|
In Real Clear Markets, Aaron Brown writes about a review of NASA's global temperature records over the past two years and reports that it reveals there has been a drop of 0.56°C — something not being reported in the main stream press. "From February 2016 to February 2018 (the latest month available) global average temperatures dropped 0.56°C. You have to go back to 1982-84 for the next biggest two-year drop, 0.47°C—also during the global warming era. All the data in this essay come from GISTEMP Team, 2018: GISS Surface Temperature Analysis (GISTEMP). NASA Goddard Institute for Space Studies (dataset accessed 2018-04-11 at https://data.giss.nasa.gov/gistemp/). This is the standard source used in most journalistic reporting of global average temperatures." He goes on to say that, "None of this argues against global warming," but points out the hypocrisy of the media. "My point is that statistical cooling outliers garner no media attention. The global average temperature numbers come out monthly. If they show a new hottest year on record, that's a big story. If they show a big increase over the previous month, or the same month in the previous year, that's a story. If they represent a sequence of warming months or years, that's a story. When they show cooling of any sort—and there have been more cooling months than warming months since anthropogenic warming began—there's no story." "How should the global average temperature data be reported? There should be equal attention on warming and cooling records. Coverage should be based on how unusual the event is, not whether or not it increases support for favored policies." |
04-24-18 | Real Clear Markets | |||||||||||||||||||||||||||||||||||||||||||||||||||||||||||||||||||
|
Despite all the evidence to the contrary (see above), those with a man-made global warming agenda continue to assert their claims as self-evident truths, no longer even bothering to try and back them up with any science at all. Take, for example, the raging fires and consequential smoke that has plagued the Pacific Northwest during the past two summers. As they have previously — and incorrectly — attempted to do with tornadoes, droughts, floods, hurricanes, and other normal weather events, they are now attempting to blame the fires on man-made global warming. Here are a few representative samples:
Whether they state it explicitly or simply hint at it, the implication for the reader in all of this obviously coordinated reporting, is that the "New Normal" is just another catastrophic consequence of man-made global warming. Fortunately, Cliff Mass, a professor of Atmospheric Sciences at the University of WA, has written an article that sets the record straight. As the following chart demonstrates, forest fires are normal and it has been man's intervention that has suppressed them. What we are actually seeing today is the result of poor forestry management practices by government stewards, not the effects of increased global temperatures. 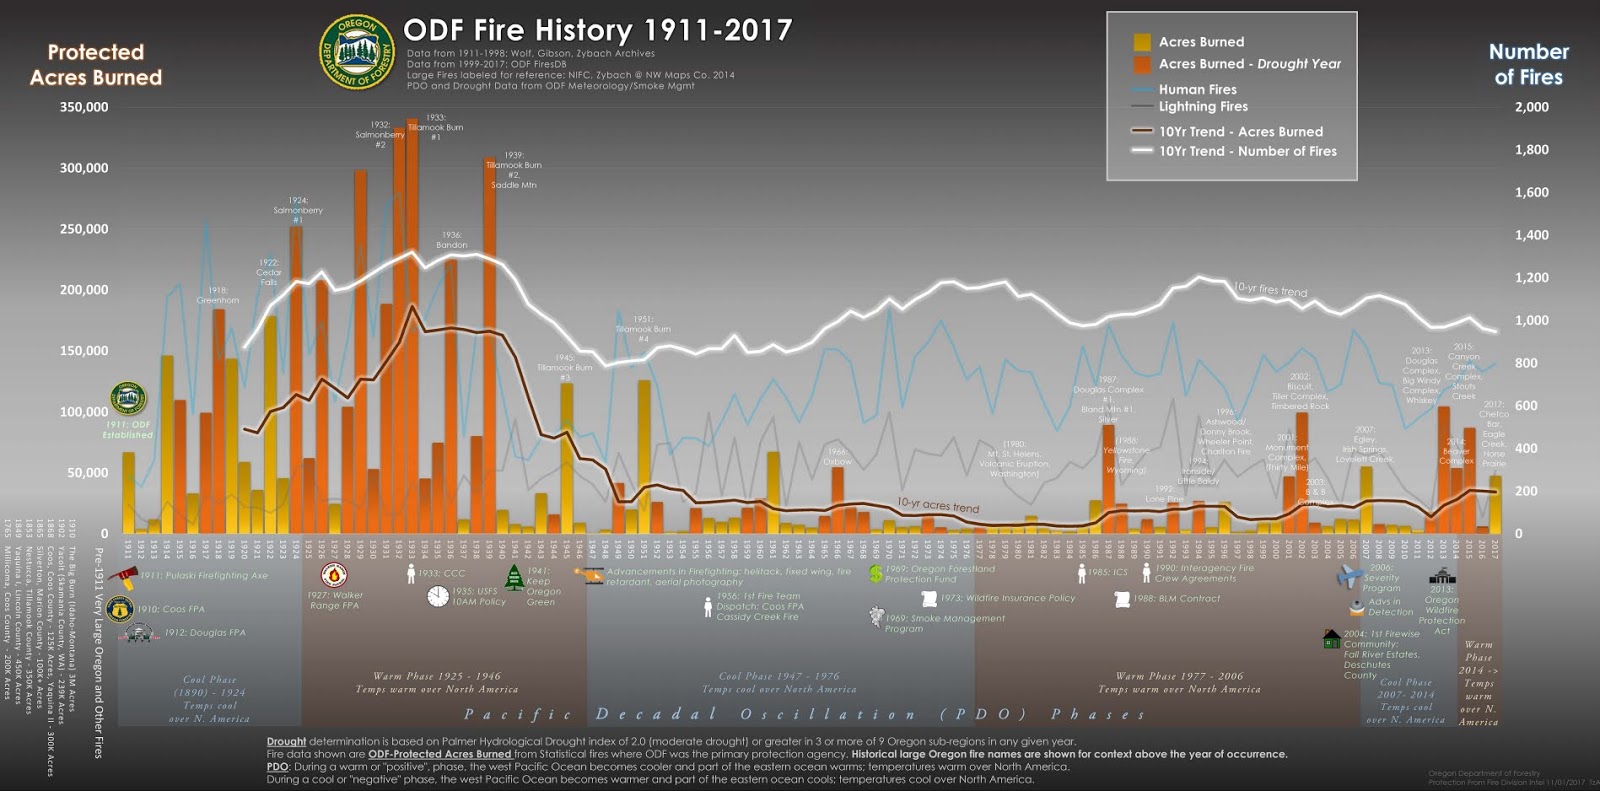 Quoting Mass [All emphasis in the original article]: "To put it succinctly, during the past few summers we have gotten a taste of the "old normal", one that was very familiar to our great grandparents and their predecessors. And one that we will experience frequently in our future if we don't take steps to restore our forests and to bring back regular fire." "Smoke and fire was part of life here in the Northwest before the period of near-total suppression began around approximately 1940." "Today, the bill for our suppression of fire and poor forest management in the Pacific Northwest and British Columbia has now come due. Those who blame our dangerous situation on a "new normal" solely resulting from climate change, are not only misinformed, but they can act as obstacles to the actions that are acutely needed: a massive effort to thin our forests and bring back low-intensity fire." An just to be clear, Mass is no global warming denier, as he states here: "Warming from increasing greenhouse gases is surely making the situation a bit worse, and its impact will undoubtedly escalate when the real warming occurs later in this century. But today, global warming is a relatively small element of the current wildfire situation, particularly in the slow to warm Pacific Northwest." He is simply an honest scientist who is unwilling to dismiss facts in service of some overriding political agenda. |
08-24-18 | Cliff Mass Blog | |||||||||||||||||||||||||||||||||||||||||||||||||||||||||||||||||||
|
Get 'em while they're hot! The Maldives are expiring soon! On September 26, 1988, the Australian Environmental Affairs director stated that the Maldive Island chain in the Indian Ocean would be completely submerged by 2018 because of rising ocean levels due to catastrophic man-made global warming. Of course, the United Nations also quickly got into the act. This alarmism over fictitious sea level rises has been reported multiple time above, here, here, here and here. Read all about it: Four Weeks Left Until The Maldives Drown |
08-29-18 | Climate Chg. Dispatch | |||||||||||||||||||||||||||||||||||||||||||||||||||||||||||||||||||
|
Hurricanes Out of Control! Not So Much. With the advent of hurricane Florence, the media is once again filled with reports of how this disaster is the consequence of man-made global — something asserted but never backed up by references to rigorous and comprehensive science made available for review. This subject has been covered before, here, here, here, here and here. in response to the latest flood of misinformation, meteorologist Roy W. Spencer wrote an article titled, Hurricane Florence is not climate change or global warning. It's just the weather., in which he makes the following points:
|
09-14-18 | USA Today | |||||||||||||||||||||||||||||||||||||||||||||||||||||||||||||||||||
|
2018 US Tornadoes Lowest in 65 Years of Record-Keeping Anthony Watts reports: "Get this — a record-low 759 tornadoes formed in the U.S. so far this year, according to the National Oceanic and Atmospheric Administration's Storm Prediction Center (SPC). According to the SPC data, there were two fewer tornadoes than the previous annual record-low of 761. Here is the NOAA chart showing the record low in tornadoes: 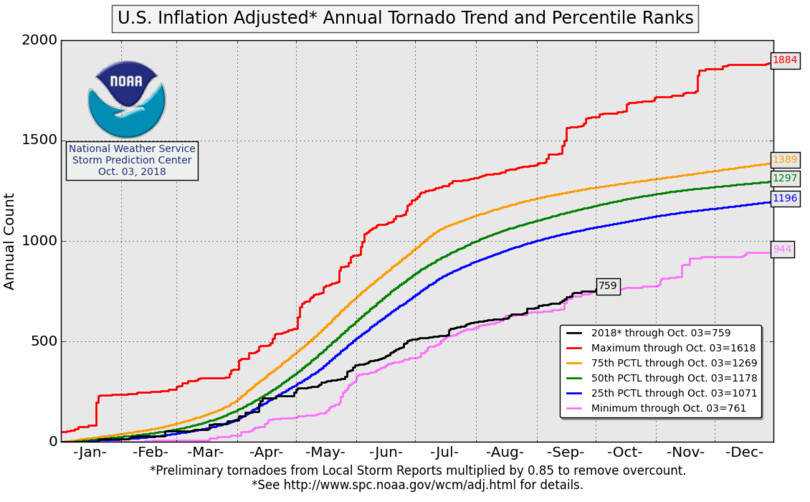 Additional charts show that neither the number nor the frequency of tornadoes is increasing over time. Watts concludes: "That certainly blows a hole in alarmist claims that climate change is making severe weather worse." |
10-04-18 | Watts Up With That? | |||||||||||||||||||||||||||||||||||||||||||||||||||||||||||||||||||
|
Wind Turbines Generate More Heat Than They Save A report in The Harvard Gazette titled, The down side to wind power, indicates that "Wind farms will cause more environmental impact than previously thought." The conclusion of two published papers, Climate Impact of Wind Power and Observation-based solar and wind power capacity factors and power densities: "Harvard University researchers find that the transition to wind or solar power in the U.S. would require five to 20 times more land than previously thought, and, if such large-scale wind farms were built, would warm average surface temperatures over the continental U.S. by 0.24 degrees Celsius." As with so much else that occurs in this field, research is based upon computer models which, time after time, prove to be wildly inaccurate. As the Gazette reports: "In previous research, Keith (David Keith) and co-authors modeled the generating capacity of large-scale wind farms and concluded that real-world wind power generation had been overestimated because they neglected to accurately account for the interactions between turbines and the atmosphere." "What was missing from this previous research, however, were observations to support the modeling." With the 2018 release of data on 57,636 wind turbines in the U.S. by the U.S. Geological Survey, along with other public data sets, Keith and co-researcher Lee Miller were able to make new assessments. As Lee Miller, the lead author of the two papers, report: "For wind, we found that the average power density — meaning the rate of energy generation divided by the encompassing area of the wind plant — was up to 100 times lower than estimates by some leading energy experts. Most of these estimates failed to consider the turbine-atmosphere interaction. For an isolated wind turbine, interactions are not important at all, but once the wind farms are more than five to 10 kilometers deep, these interactions have a major impact on the power density." The researchers further determined that if sufficient wind generators were constructed to meet the electrical power requirements of the U.S., they would actually warm the continent by 0.24°C due to a combination of atmospheric mixing and slowing of the wind, a conclusion borne out by satellite data for existing wind farms. In conclusion: "The Harvard researchers found that the warming effect of wind turbines in the continental U.S. was actually larger than the effect of reduced emissions for the first century of its operation. This is because the warming effect is predominantly local to the wind farm, while greenhouse gas concentrations must be reduced globally before the benefits are realized." |
010-04-18 | The Harvard Gazette | |||||||||||||||||||||||||||||||||||||||||||||||||||||||||||||||||||
|
Oceans Fail to Obey King Canute and the IPCC! As the story goes, the Norse king, Canute the Great, was surrounded by sycophants who thought him to be all powerful. In response, the king had his throne set at the edge of the sea and commanded the tides to halt. Of course they continued to rise, whereupon he informed everyone, "Let all men know how empty and worthless is the power of kings, for there is none worthy of the name, but He whom heaven, earth, and sea obey by eternal laws." It appears that the IPCC and Climate Alarmists have not yet learned the king's lesson. As reported by Anthony Watts: "For the last 20 years climate scientists and campaigners have warned that atolls and low-lying islands are facing an imminent threat to their existence due to climate change and sea level rise which could soon cause the complete disappearance of entire islands. A new paper that reviews Pacific and Indian Ocean atolls including 709 islands reveals that no atoll lost land area and that 88.6% of islands were either stable or increased in area, while only 11.4% contracted." Conclusion: "Atoll and island areal stability can therefore be considered as a global trend." |
10-29-18 | Watts Up With That? | |||||||||||||||||||||||||||||||||||||||||||||||||||||||||||||||||||
|
Anthony Watts reports: Moving The Goalpost: IPCC Secretly Redefines what 'Climate' Means
"The definition of 'climate' adopted by the World
Meteorological Organisation is the average of a particular
weather parameter over 30 years. It was introduced at the 1934
Wiesbaden conference of the International Meteorological
Organisation (WMO's precursor) because data sets were only held
to be reliable after 1900, so 1901 – 1930 was used as an
initial basis for assessing climate. It has a certain
arbitrariness, it could have been 25 years.
[...]
"[T]his new definition of climate and global warming is not
only philosophically unsound, it is also open to speculation and
manipulation. It is one thing to speculate what the future
climate might be; but for the IPCC to define climate based on
data that doesn't yet exist and is based on expectations of
what might happen in the future is fraught with danger.
Read the entire article for charts and a more complete explanation. |
10-29-18 | Watts Up With That? | |||||||||||||||||||||||||||||||||||||||||||||||||||||||||||||||||||
|
There are many references above regarding the manipulation of the raw temperature data in Europe and the United States so as to fabricate or exaggerate a warming trend beyond what the actual data indicates. The same thing has also been observed being done by the Australian Bureau of Meteorology (BoM). Francis Menton has been publishing a series of blog posts under the heading, The Greatest Scientific Fraud Of All Time. In Part 21 he discusses research conducted by Jennifer Marohasy on the manipulations of the data at the Darwin, AU stations — taken as just one representative example. He points out that early data (1895-1910) has suspiciously been ignored while the raw (direct) temperature readings from 1910 on were artificially lowered, based upon an "impenetrable" rationally. Most importantly, an original adjustment used to create the ACORN1 dataset lowered the original temperatures by 0.4° C. 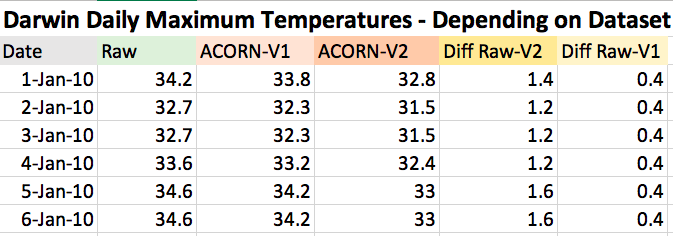 However, just six years later, a new dataset — ACORN2 — has been created, lowering the temperatures by an additional ± 1° C. Quoting from the article: "Are you still wondering if there is anything honest about this? Marohasy compiles a graph of the raw mean maximum annual temperatures as recorded at Darwin, versus the "adjusted" ACORN2 series that is now Australia's official temperature record. Note that the site did move in 1941, from the post office in downtown Darwin out to the airport. To indicate the discontinuity, Marohasy graphs the post office series in green, and the airport in blue. Here is her graph:" 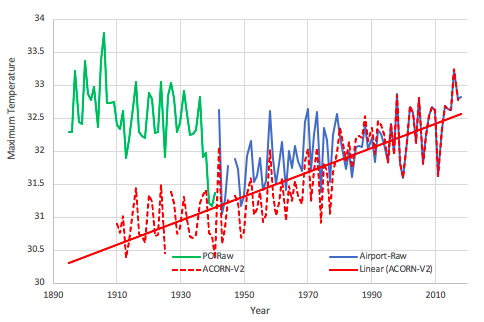 "Is the post office site systematically warmer than the airport site? Note that the last several years at the post office were considerably cooler than the first years at the airport. But the BoM has made the executive decision to replace the temperatures recorded at the post office in the period 1910 to 1941 with temperatures that average about 1.5 deg C cooler. Pre-adjustments, 1906 looks like the year with the hottest mean maximum temperature, and by a wide margin; and number two is also pre-1910. Post-adjustments, the warmest is 2016. This is how you get to have "hottest year ever" press releases every year or two. In Part 22, the author responds to some of the questions readers raised regarding the material presented here. |
02-24-19 | Manhattan Contrarian | |||||||||||||||||||||||||||||||||||||||||||||||||||||||||||||||||||
|
Data from the National Oceanic and Atmospheric Administration (NOAA), show that the claims that sea level rise has been accelerating over the past three decades is false.
"NOAA tide gauge data measurements exist for 17 locations along
the California coast with 8 of these locations having actual
measured sea level rise data covering periods for more than 70
to 120 years in duration.
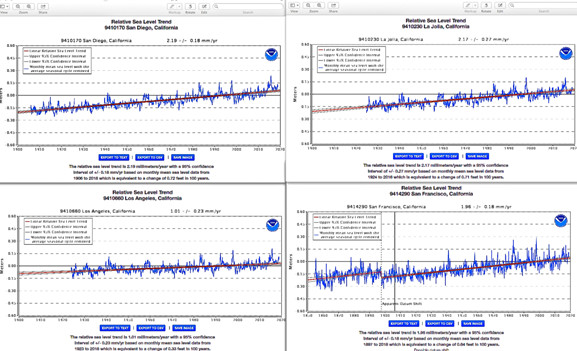 |
03-13-19 | Watts Up With That? | |||||||||||||||||||||||||||||||||||||||||||||||||||||||||||||||||||
|
In the article titled A Sea Level Rise Conundrum — Greenland's Cycles, Jim Steele writes about the ongoing cyclic nature of the melting and reformation of glacial ice on Greenland and it's contribution to both seal level rise and lowering. Here are a few excerpted paragraphs that summarize his point: "During the last 100 years, Greenland oscillated between gaining and losing ice. Its greatest loss raised sea level by 0.07 inches in 2012, about half the total sea level rise of 0.12 inches a year. That accelerated loss was trumpeted as just what climate models predict. However, Greenland's melt rates then declined and by 2017 it was gaining enough ice to slightly reduce sea level rise." "[R]esearchers reported Greenland's ice-free regions experienced various warming and cooling trends over the past 15 years, but concluded if there was any general trend, 'it is mostly a cooling'. They also admitted they 'cannot differentiate between anthropogenic forcing [in other words: warming from human added CO₂] and natural fluctuations.'" "A similar warming and melting episode occurred decades earlier. Climate scientists determined Greenland had warmed most rapidly between 1920 and 1940. ... Intriguingly, much lower CO₂ concentrations still resulted in similar warming, melting and rates of sea level rise." "Until Greenland's temperatures and ice-melt exceed the 1930s episode, scientists cannot distinguish between natural variability and human-caused warming." |
03-21-19 | Watts Up With That? | |||||||||||||||||||||||||||||||||||||||||||||||||||||||||||||||||||
|
In and article titled, "Cooling Down the Hysteria About Global Warming," Rich Enthoven provides a nice discussion and summary of a number of issues that have been reported elsewhere. His article provides references and links to the sources he cites. He begins by reviewing the problem with many land-based temperature data sets that do not properly account for urbanization growth and the resulting heat island effect. As one example, NASA reports that 2018 was the fourth hottest year on record, with a total increase of .31° C over the past ten years, depicted in the chart on the left. In contrast, the chart on the right shows NOAA data taken from a set of 114 monitoring stations specifically chosen to avoid the impact from urbanization. These locations report no average temperature increase over the past decade. 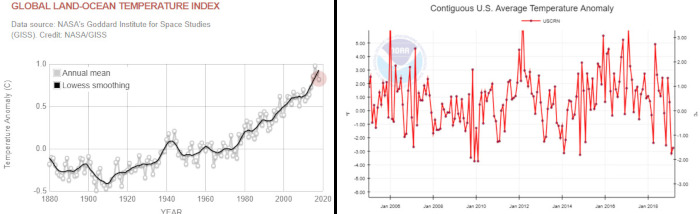 "And it is not just the US rural temperatures that are stable — all around the globe, temperature growth is eliminated once land use changes are eliminated."
Next he reviews the problems with ocean temperature measurement.
"Ocean temperatures have been measured over the years with highly
inconsistent methods (buckets off ships; water flowing through
ship engine rooms; buoys; and lately, satellites) In addition
to technology changes, there are short term annual ocean cycles
such as the well-publicized El Nino/La Nina and long term (multi
decade) cycles such as the Pacific (and Atlantic) Decadal
Oscillations which affect ocean temperatures at many depths over
decades. A recent report out of UC San Diego described the problem
'Determining changes in the average temperature of the entire
world's ocean has proven to be a nearly impossible task due to the
distribution of different water masses.'
Enthoven discusses how NASA — and others, as reported many times above – have significantly manipulated their data in order to manufacture the desired warming trend. "A major problem is that the average adjustments between raw and final data average strongly in one direction — the adjustments tend to cool the past — which makes the present temperatures seem warmer by comparison." He then covers a number of climate predictions that have been wrong in the extreme.
Read the entire article for a fuller picture and sources for this information. |
04-21-19 | Watts Up With That? | |||||||||||||||||||||||||||||||||||||||||||||||||||||||||||||||||||
|
In Forbes, author Michael Shellenberger published an article titled: The Reason Renewables Can't Power Modern Civilization Is Because They Were Never Meant To Here, he reviews the state of Germany's bold efforts to transition the country to renewable energy. He reports that in 2018 the government stated that it "would not meet its 2020 greenhouse gas reduction commitments" and that it planned to re-commit to coal mining with "plans to bulldoze an ancient church and forest in order to get at the coal underneath it."
Here are a few other interesting quotes: "Der Spiegel cites a recent estimate that it would cost Germany '€3.4 trillion ($3.8 trillion),' or seven times more than it spent from 2000 to 2025, to increase solar and wind three to five-fold by 2050." "Of the 7,700 new kilometers of transmission lines needed, only 8% have been built, while large-scale electricity storage remains inefficient and expensive. 'A large part of the energy used is lost,' the reporters note of a much-hyped hydrogen gas project, 'and the efficiency is below 40%... No viable business model can be developed from this.'" "[N]o amount of marketing could change the poor physics of resource-intensive and land-intensive renewables. Solar farms take 450 times more land than nuclear plants, and wind farms take 700 times more land than natural gas wells, to produce the same amount of energy."
"Many Germans will, like Der Spiegel, claim the renewables
transition was merely 'botched,' but it wasn't. The transition
to renewables was doomed because modern industrial people, no
matter how Romantic they are, do not want to return to pre-modern
life.
|
05-06-19 | Forbes | |||||||||||||||||||||||||||||||||||||||||||||||||||||||||||||||||||
|
Environmental scientist, Vijay Jayaraj, reports on a recent paper published in the Royal Meteorological Society's International Journal of Climatology, titled: which Jayaraj summarizes as follows:
"A new temperature reconstruction, using proxy temperature
measurements from locations in central Asia, has revealed that
there has been no warming in the past 432 years."
"[M]ore and more studies are beginning to indicate that there has been no significant warming trend in the past five centuries. "Among them is the recent paper by Byambaa et.al., which reveals a lack of warming in Central Asia since 1580 A.D.
"The paper used tree ring-width proxy temperature measurements to
calculate the mean June-July air temperatures for the period
1402-2012 and June-December precipitation for the period 1569-2012."
"The authors conclude that the past 5 centuries have been relatively cooler. They also find the 20th century to be slightly warmer, but the warming was discontinuous. However, the 20th century warming eventually collapsed due to late 20th century cooling, which they deem common across the mountains of China and Nepal. They also find that solar cycles and volcanic activity were the major reasons for temperature anomalies during the past 5 centuries—not carbon dioxide. "Numerous other studies have attested this recent cooling in Central Asia, especially China. Temperature readings from 118 national weather stations since 1951 in Northeast China reveal a remarkable and significant cooling in China since 1998, the same year since which global atmospheric temperature failed to show any significant warming. Other studies show this trend over all of China. "China is not the only country to experience this late 20th century cooling." Read the article for additional details. |
05-16-19 | Watts Up With That? | |||||||||||||||||||||||||||||||||||||||||||||||||||||||||||||||||||
|
Apocalyptic Rhetoric About Extreme Weather Keeps Ramping Up. But Experts Say There's No Emergency Canadian economist Ross McKitrick writes in the Financial Post about the many exaggerated weather-related claims constantly being offered up by politicians, environmentalists and the media in support of their alarmist claims regarding "global warming"—claims contradicted by the UN's own Intergovernmental Panel on Climate Change (IPCC). McKitrick Addresses the following weather topics: FloodingQuoting from chapter two, page 214 of the IPCC's Assessment Report [PDF]: "In summary, there continues to be a lack of evidence and thus low confidence regarding the sign of trend in the magnitude and/or frequency of floods on a global scale." and from chapter three, page 176 of their 2012 Report [PDF]: "In the United States and Canada during the 20th century and in the early 21st century, there is no compelling evidence for climate-driven changes in the magnitude or frequency of floods." DroughtsQuoting from chapter two, page 215 of the IPCC's Assessment Report [PDF]: "In summary, the current assessment concludes that there is not enough evidence at present to suggest more than low confidence in a global-scale observed trend in drought or dryness (lack of rainfall) since the middle of the 20th century, owing to lack of direct observations, geographical inconsistencies in the trends, and dependencies of inferred trends on the index choice." The report further indicates that droughts appear to be decreasing in central North America. PrecipitationQuoting from chapter two, page 202 of the IPCC's Assessment Report [PDF]: "In summary, confidence in precipitation change averaged over global land areas is low for the years prior to 1950 and medium afterwards because of insufficient data, particularly in the earlier part of the record. Available globally incomplete records show mixed and non-significant long-term trends in reported global mean changes. Further, when virtually all the land area is filled in using a reconstruction method, the resulting time series shows less change in land-based precipitation since 1900." and from pages 213-214: "[I]t is likely that since 1951 there have been statistically significant increases in the number of heavy precipitation events (e.g., above the 95th percentile) in more regions than there have been statistically significant decreases, but there are strong regional and subregional variations in the trends. In particular, many regions present statistically non-significant or negative trends, and, where seasonal changes have been assessed, there are also variations between seasons." TornadoesQuoting from chapter three, pages 211-212 of the 2012 Report [PDF]: "There is low confidence in observed trends in small-scale phenomena such as tornadoes and hail because of data inhomogeneities and inadequacies in monitoring systems." and from page 150: "Regarding other phenomena associated with extreme winds, such as thunderstorms, tornadoes, and mesoscale convective complexes, studies are too few in number to assess the effect of their changes on extreme winds. As well, historical data inhomogeneities mean that there is low confidence in any observed trends in these small-scale phenomena." The repeated acknowledgement by the IPCC itself that there is a low-confidence in projecting trends from the available data for these types of weather events makes it clear that the alarmist views being expressed daily by politicians and the "news" media are nothing more than unfounded propaganda and should be dismissed out of hand. |
06-21-19 | Financial Post | |||||||||||||||||||||||||||||||||||||||||||||||||||||||||||||||||||
|
Anthony Watts takes another look at recent NOAA temperature data, pointing out that the government organization continues to rely upon very questionable data from reporting stations in the Cooperative Observer Program (COOP) Network, while continually ignoring data from the superior US Climate Reference Network (USCRN) which NOAA also maintains. Data from USCRN show that six of the past nine months, including June, have been below normal as indicated in the following table: 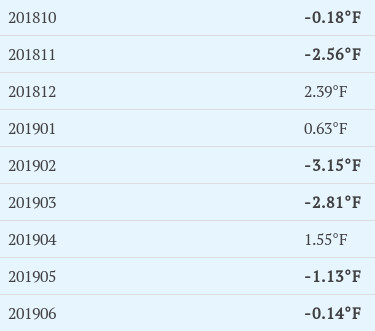
"In fact, for the June 2019 State of the Climate Report, NOAA is claiming that the US was 0.2F above average in June, when in fact the US Climate Reference Network reported the June data as below average at -0.14°F" Furthermore:"The data, taken directly from NOAA's national climate data page, shows not only that much of 2019 was below average, but that the US Temperature average is actually cooler now for 2019 than we were in 2005, when the dataset started." 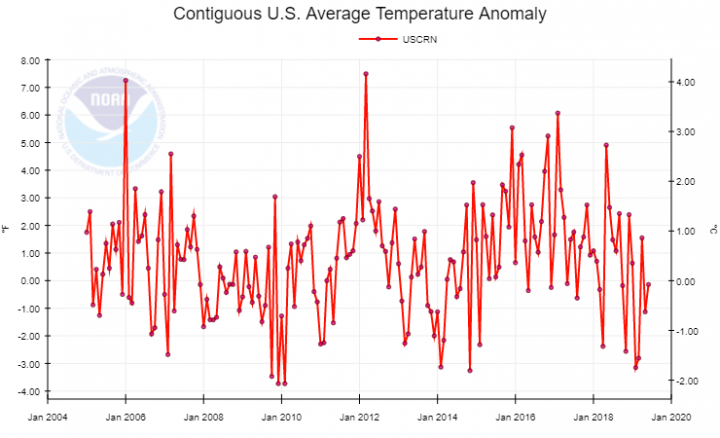 This is just one more piece of evidence which bring all of the NOAA temperature and climate conclusion under suspicion. |
07-30-19 | Watts Up With That? | |||||||||||||||||||||||||||||||||||||||||||||||||||||||||||||||||||
|
A Deadly Heat Wave After the Hottest June On Record: How the
Climate Crisis Is Creating 'a New Normal'
July Was the Hottest Month in Human History
July was Earth's hottest month on record, beating or
tying July 2016
July was hottest month ever recorded on Earth,
preliminary data shows
July expected to be Earth's hottest month on
record
It's not just this heat wave. July 2019 is likely to be the
hottest month ever measured. Listening to the media, it appears that we are seeing an inevitable climate crisis unfolding before our eyes. Of course, these and other reports are not the product of independent investigative journalism, but merely the regurgitation of pronouncements from a small group of governmental figures such as NOAA, the United Nations or the UK's Met Office, none of which are disinterested scientific observers. In an article titled July 2019 Was Not the Warmest on Record, Dr. Roy Spencer challenges the conclusions and argues that:
"One would think that the very best data would be used to make
this assessment. After all, it comes from official government
sources (such as NOAA, and the World Meteorological Organization
[WMO]).
Read the article for the reasons he draws these conclusions. He then makes the case that meteorological reanalysis, a process used to yield the best local weather forecasting, should be applied to global climate analysis as well.
"Various weather forecast centers around the world have experts
who take a wide variety of data from many sources and figure out
which ones have information about the weather and which ones don't.
"This kind of physics-based extrapolation (which is what weather forecasting is) is much more realistic than (for example) using land surface temperatures in July around the Arctic Ocean to simply guess temperatures out over the cold ocean water and ice where summer temperatures seldom rise much above freezing. This is actually one of the questionable techniques used (by NASA GISS) to get temperature estimates where no data exists." Spencer then looks at the July 2019 temperature data specifically.
"The only reanalysis data I am aware of that is available in near
real time to the public is from WeatherBell.com, and
comes from NOAA's Climate Forecast System Version 2 (CFSv2).
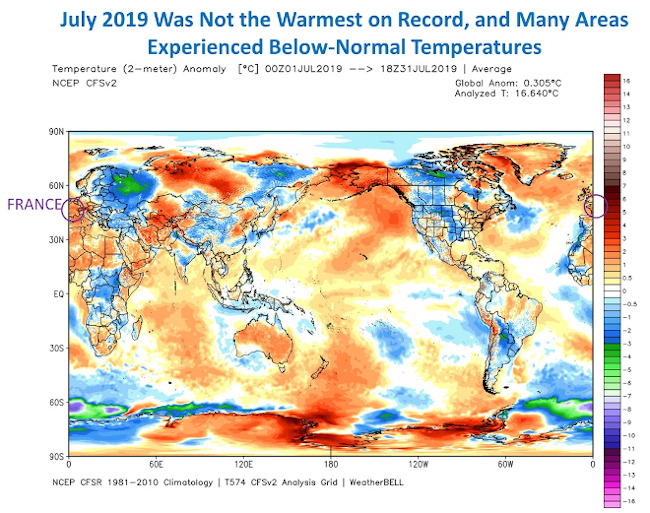
"Note from that figure how distorted the news reporting was
concerning the temporary hot spells in France, which the media
reports said contributed to global-average warmth. Yes, it was
unusually warm in France in July. But look at the cold in
Eastern Europe and western Russia. Where was the reporting on
that? How about the fact that the U.S. was, on average, below
normal?
"Where was the reporting on that?" Exactly. Today's media is a polarized filter, allowing through only statements which support the global warming agenda while filtering out everything else that might bring the forgone conclusions — and the political agenda they support — into question. |
08-02-19 | Watts Up With That? | |||||||||||||||||||||||||||||||||||||||||||||||||||||||||||||||||||
|
In an op/ed piece for the Wall Street Journal titled, If You Want 'Renewable Energy.' Get Ready to Dig, Mark Mills, a senior fellow at the Manhattan Institute, discusses some of the actual up-front monetary and environmental costs of producing the "green" infrastructure that is presented as the ecological future of mankind. Here are a few excerpts that get to the core of his thesis: "'Renewable energy' is a misnomer. Wind and solar machines and batteries are built from nonrenewable materials. And they wear out. Old equipment must be decommissioned, generating millions of tons of waste. The International Renewable Energy Agency calculates that solar goals for 2050 consistent with the Paris Accords will result in old-panel disposal constituting more than double the tonnage of all today's global plastic waste." "A single electric-car battery weighs about 1,000 pounds. Fabricating one requires digging up, moving and processing more than 500,000 pounds of raw materials somewhere on the planet." "If electric vehicles replace conventional cars, demand for cobalt and lithium, will rise more than 20-fold. That doesn't count batteries to back up wind and solar grids." "Building one wind turbine requires 900 tons of steel, 2,500 tons of concrete and 45 tons of nonrecyclable plastic." "[M]ining and fabrication require the consumption of hydrocarbons. Building enough wind turbines to supply half the world's electricity would require nearly two billion tons of coal to produce the concrete and steel, along with two billion barrels of oil to make the composite blades." |
08-05-19 | Wall Street Journal | |||||||||||||||||||||||||||||||||||||||||||||||||||||||||||||||||||
Let's recall some of the old "Climategate" correspondence that was so revealing about the methods and intentions of the government-funded researchers. Back in 1999, shortly after Mann released his hockey stick graph, Phil Jones of the University of East Anglia's Climate Research Unit, sent a message to Ray Bradley where he stated: "I've just completed Mike's [Michael Mann's] Nature trick of adding in the real temps to each series for the last 20 years (ie from 1981 onwards) and from 1961 for Keith's to hide the decline." [Emphasis added] In 2004, Jones writing to Mann expresses concern that viewpoints contrary to theirs are getting into print and must be stopped by any means. He writes: "I can't see either of these papers being in the next IPCC report. Kevin and I will keep them out somehow — even if we have to redefine what the peer-review literature is!" [Emphasis added] In 2005 Jones replied to Mann who was discussing his efforts to conceal his research data from review by others, and Jones responded: "The two MMs have been after the CRU station data for years. If they ever hear there is a Freedom of Information Act now in the UK, I think I'll delete the file rather than send to anyone." [Emphasis added] Timothy Ball, a geographer and instructor at Canada's University of Winnipeg, has been a long-standing critic regarding both the methodology as well as the predictions offered by the global warming alarmists such as Jones and Mann. As a consequence of Mann's role revealed through the Climategate documents, as well as his stonewalling in sharing his research and data for external review, Ball once famously said that Mann "belongs in the state pen, not Penn State." Subsequently, in 2011 Mann sued Ball for defamation. Because of the ponderous working of the legal system, eight years later the Canadian Court has finally not only dismissed the multi-million dollar suit, but ordered Mann to pay all of Ball's legal expenses. While the hockey stick chart has been roundly discredited long ago, the defamation suit hinged upon the question of whether Mann did or did not intentionally falsify the graph. (i.e., using "Mike's Nature trick" noted above.) In order to determine that, the court ordered that he submit his data for review. Once again, Mann refused and the court was left with no alternative but to dismiss the case. |
08-22-19 08-23-19 08-24-19 |
Watts Up With That? Principia Scientific PowerLine |
|||||||||||||||||||||||||||||||||||||||||||||||||||||||||||||||||||
|
Patrick Frank, a life sciences research professor at Stanford's SLAC National Accelerator Laboratory, has published a peer-reviewed research paper titled, Propagation of Error and the Reliability of Global Air Temperature Projections, in the journal Frontiers in Earth Science. In this article, Frank assesses the UN IPCC's 2013 assertion that man-made CO₂ emissions will raise the average global temperature by 3° C by 2100.
In the discussion
of his article at Whats Up With That?, Frank points out that
some of the problems he has observed with climate modelers are that
they:
While the details of his analysis is fairly technical and math-intensive, he summarizes his findings as follows:
"The paper shows that advanced climate models project air
temperature merely as a linear extrapolation of greenhouse gas
(GHG) forcing. That fact is multiply demonstrated, with the bulk
of the demonstrations in the SI [Supporting
Information]. A simple equation, linear in forcing,
successfully emulates the air temperature projections of virtually
any climate model. Willis Eschenbach also discovered that
independently, awhile back.
|
09-06-19 09-07-19 |
Frontiers in Earth Sci. Watts Up With That? |
|||||||||||||||||||||||||||||||||||||||||||||||||||||||||||||||||||
|
Following up to the Michael Mann entry above, here is a nice five minute video summary by Tony Heller of Real Climate Science, which explains how Michael Mann cherry-picked his data to obtain the "catastrophic" warming results he uses to falsely build his case. |
09-14-19 |
Real Climate Science
YouTube |
|||||||||||||||||||||||||||||||||||||||||||||||||||||||||||||||||||
|
On September 23, 2019, the same day that Greta Thunberg was giving her speech to the UN, an international group of 500 scientists and professionals in climate-related fields submitted a letter to the UN, with an accompanying document expressing their view that There Is No Climate Emergency. Summarizing the main points of the document:
Despite submitting 500 press releases to media contacts, this was not reported in any of the main stream news outlets, despite their claim to be fairly covering the subject. The signatories can be found listed at the end of the document. |
09-23-19 |
Letter - [PDF] Document - [PDF] |
|||||||||||||||||||||||||||||||||||||||||||||||||||||||||||||||||||
|
Tony Heller has produces another 13 minute video which shows how NASA has manipulated its own weather record to conceal the actual hottest month on record prior to 1980 — March 1878 — in order to mislead the public as to the severity of the late 20th century temperature rise. This was done by ignoring (hiding) all temperature data prior to 1880, artificially cooling past temperatures and artificially warming recent temperature data. In 2000, NASA temperature records showed approximately a 0.5° warming between 1860 and 2000. However, using the techniques exposed by Heller, by 2017 NASA's revised data indicated a more than doubling in global warming between 1880 and 2000 of 1.2°. The Australian Bureau of Meteorology was even worse, erasing all temperature data prior to 1910. |
09-28-19 |
Real Climate Science
YouTube |
|||||||||||||||||||||||||||||||||||||||||||||||||||||||||||||||||||
|
NASA Pinpoints Cause of Earth's Recent Record Carbon Dioxide Spike In a new report, NASA indicates that the largest release of CO₂ seen over the past 2,000 years was entirely natural. Excerpts from the article: "A new NASA study provides space-based evidence that Earth's tropical regions were the cause of the largest annual increases in atmospheric carbon dioxide concentration seen in at least 2,000 years. "Scientists suspected the 2015-16 El Nino — one of the largest on record — was responsible, but exactly how has been a subject of ongoing research. Analyzing the first 28 months of data from NASA's Orbiting Carbon Observatory-2 (OCO-2) satellite, researchers conclude impacts of El Nino-related heat and drought occurring in tropical regions of South America, Africa and Indonesia were responsible for the record spike in global carbon dioxide." 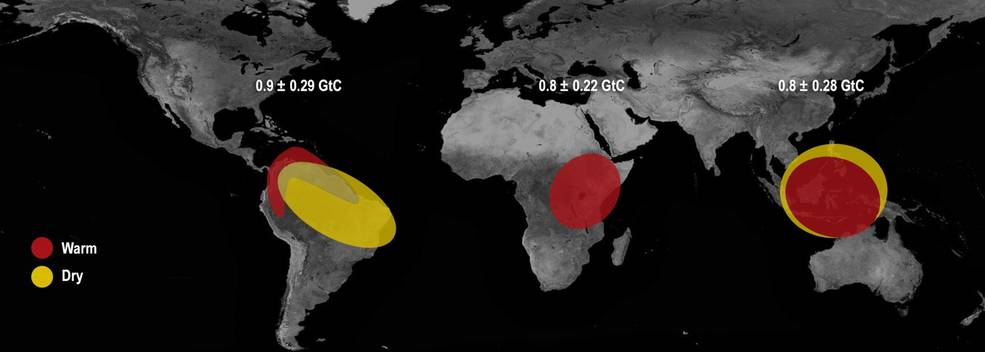 "'These three tropical regions released 2.5 gigatons more carbon into the atmosphere than they did in 2011,' said Junjie Liu of NASA's Jet Propulsion Laboratory (JPL) in Pasadena, California, who is lead author of the study. 'Our analysis shows this extra carbon dioxide explains the difference in atmospheric carbon dioxide growth rates between 2011 and the peak years of 2015-16. OCO-2 data allowed us to quantify how the net exchange of carbon between land and atmosphere in individual regions is affected during El Nino years.'" "In 2015 and 2016, OCO-2 recorded atmospheric carbon dioxide increases that were 50 percent larger than the average increase seen in recent years preceding these observations." "In eastern and southeastern tropical South America, including the Amazon rainforest, severe drought spurred by El Nino made 2015 the driest year in the past 30 years. Temperatures also were higher than normal. These drier and hotter conditions stressed vegetation and reduced photosynthesis, meaning trees and plants absorbed less carbon from the atmosphere. The effect was to increase the net amount of carbon released into the atmosphere. "In contrast, rainfall in tropical Africa was at normal levels, based on precipitation analysis that combined satellite measurements and rain gauge data, but ecosystems endured hotter-than-normal temperatures. Dead trees and plants decomposed more, resulting in more carbon being released into the atmosphere. Meanwhile, tropical Asia had the second-driest year in the past 30 years. Its increased carbon release, primarily from Indonesia, was mainly due to increased peat and forest fires — also measured by satellite instruments." "The concentration of carbon dioxide in Earth's atmosphere is constantly changing. It changes from season to season as plants grow and die, with higher concentrations in the winter and lower amounts in the summer. Annually averaged atmospheric carbon dioxide concentrations have generally increased year over year since the early 1800s — the start of the widespread Industrial Revolution." [Emphasis added] Aah, there it is! Now NASA could have also just as easily said: "since the early 1800s — the end of the Little Ice Age, when the earth began to naturally warm once again." You decide why it's one statement and not the other. |
10-12-19 | NASA | |||||||||||||||||||||||||||||||||||||||||||||||||||||||||||||||||||
|
Here is another example of the U.S. government lying through the manipulation of data in order to prop up the catastrophic climate-change narrative, when the data fails to produce the desired results. In the 2014 National Climate Assessment Report produced by the U.S. Global Change Research Program (USGCRP), the following graph was included as evidence of an increase in North Atlantic hurricane frequency, intensity and duration. 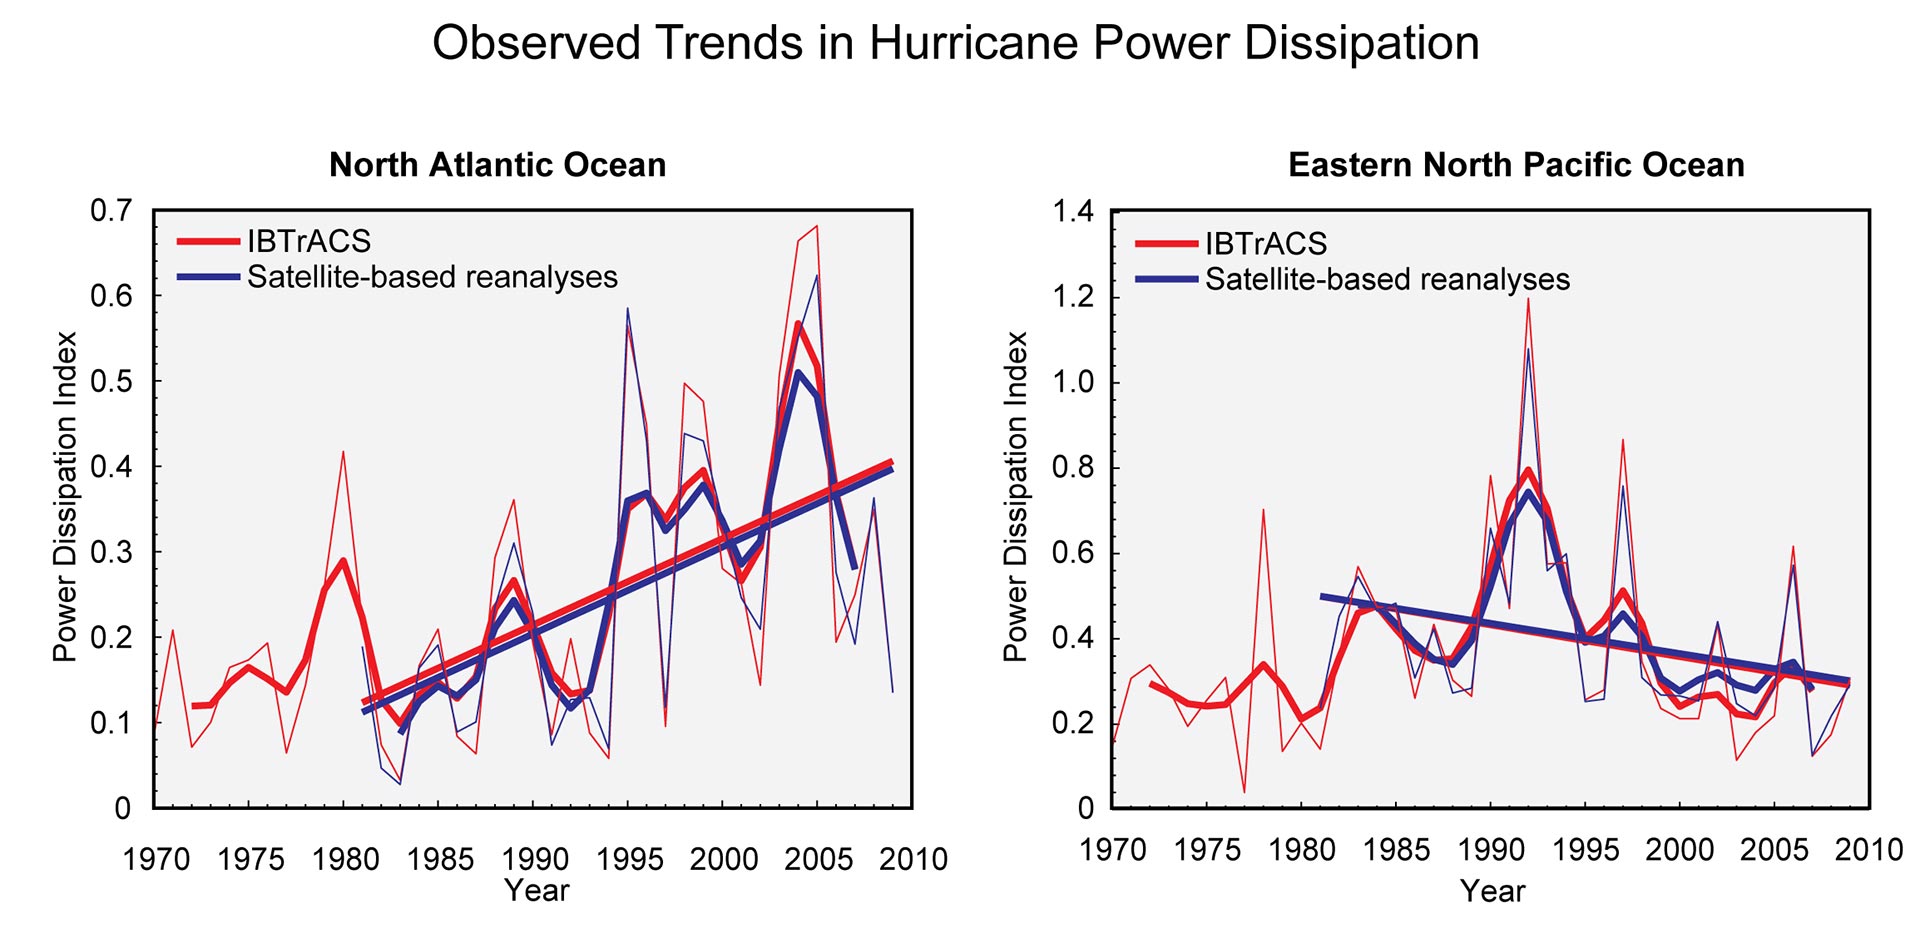 In an article published by the Competitive Enterprise Institute, Patrick J. Michaels, an environmental sciences research professor, took a look at the data behind this chart, relying on the work of Dr. Ryan Maue.
"By 1970, we could surveil the entire domain where hurricanes roam,
so we know both the track and the intensity of every one since
then. It then devolves upon someone with a lot of patience to
sort through all that imagery and catalog the time-intensity
history of dreaded tropical cyclones.
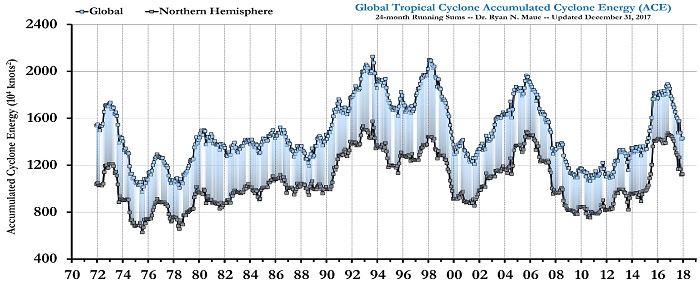 Michaels asked Maue to extract the North Atlantic data and recalculate the Power Dissipation Index using MIT's Kerry Emanuel method which was used by the USGCRP. Here are the results: 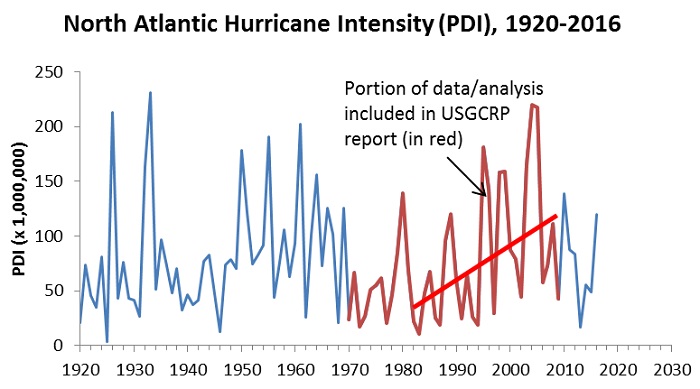 Michaels concludes:
"You will notice two things.
|
10-16-19 | CEI | |||||||||||||||||||||||||||||||||||||||||||||||||||||||||||||||||||
|
An article titled, Australian legislator uncovers that country's Bureau of Meteorology fiddling with temperature records to hype warming, the author reports that Australian MP Craig Kelly discovered a clear case where the country's Bureau of Meteorology manipulated temperature data in order to manufacture the appearance of accelerating heating of the earth. 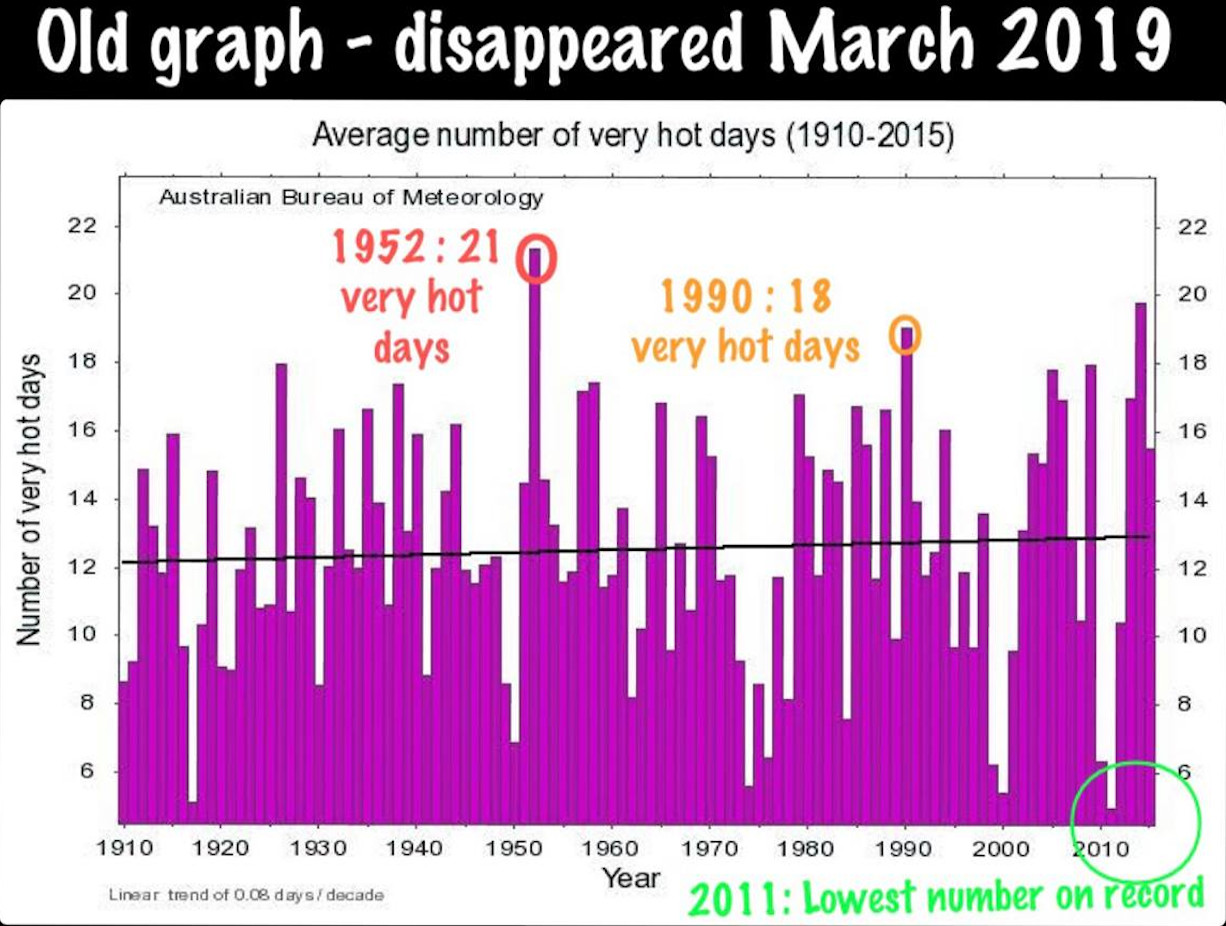 In the Bureau's original graph, 1952 showed the highest number of "very hot days," while 2011 showed the lowest. 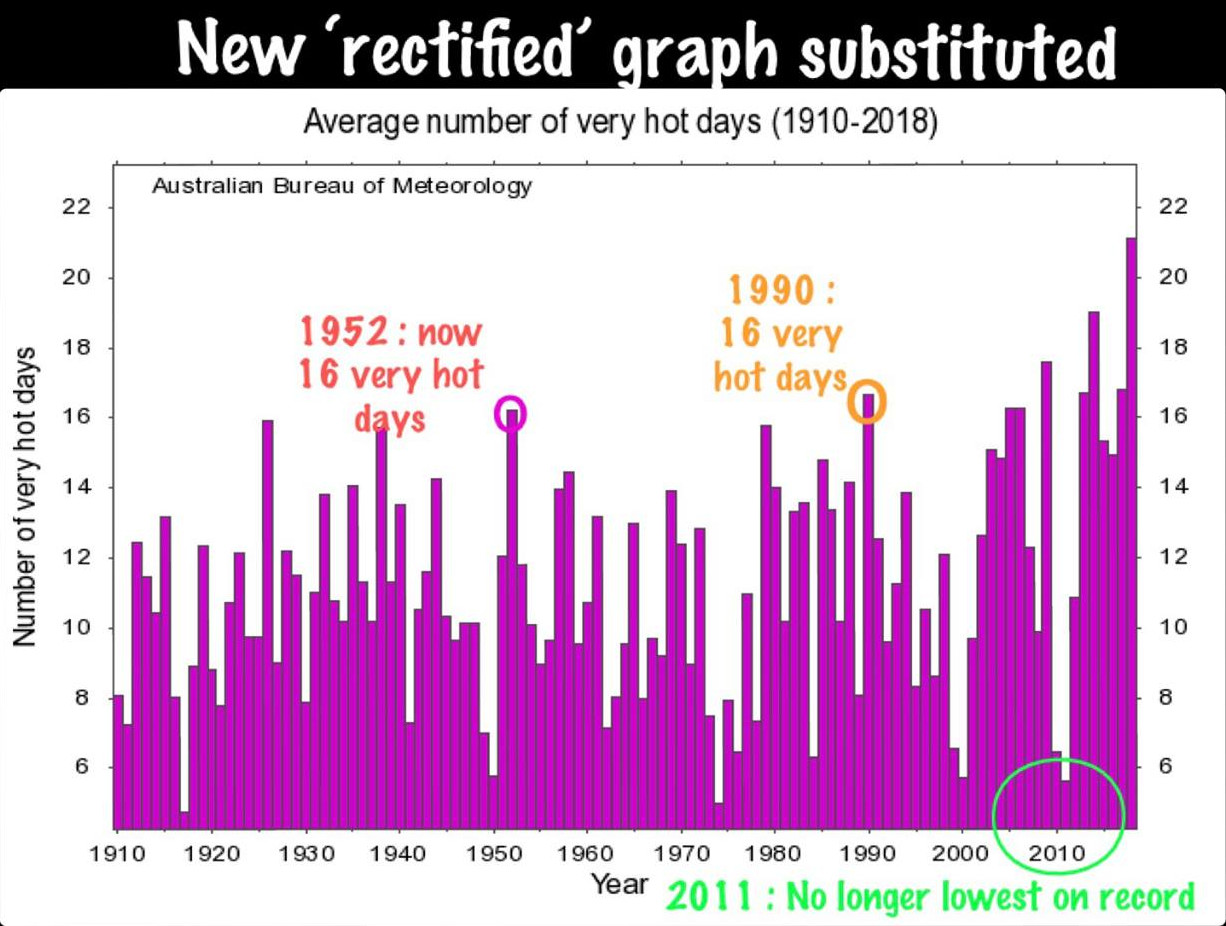 In the revised graph, the 2011 data was "warmed" to eliminate it as the lowest year, while the data for 1952 and 1990 were obviously decreased and data for a number of other years was altered in order to create the impression of an ever increasing warming trend. As we have seen time and again in many examples listed above, the data is manipulated to fit the desired result, making the entire enterprise not one of science, but of propaganda — something not lost on Mr. Kelly, who goes on to quote George Orwell's Novel, Nineteen Eighty-Four: "There were the vast repositories where the corrected documents were stored, and the hidden furnaces where the original copies were destroyed. And somewhere or other, quite anonymous, there were the directing brains who co-ordinated the whole effort and laid down the lines of policy which made it necessary that this fragment of the past should be preserved, that one falsified, and the other rubbed out of existence." |
10-26-19 | American Thinker | |||||||||||||||||||||||||||||||||||||||||||||||||||||||||||||||||||
|
As we near the 10th anniversary of the Climategate scandal (see above) which revealed that the major climate researchers in the government-funded universities were manipulating data, fudging computer models, illegally concealing and/or destroying their research methods, and controlling the flow of information released through professional channels, physicist Dr Kelvin Kemm provides a short retrospective of what we have learned since then and where we now stand. Here are a few points he makes that are worth reviewing: "The scandal should have ended climate catastrophism. Instead, it was studiously buried by politicians, scientists, activists and crony capitalists, who will rake in trillions of dollars from the exaggerations and fakery, while exempting themselves from the damage they are inflicting on everyday families." "[S]ince 1998, average global temperatures have risen by a mere few hundredths of a degree. ... Yet all we hear is baseless rhetoric about manmade carbon dioxide causing global warming and climate changes that pose existential threats to humanity, wildlife and planet." "Since California became a state [in 1850], the measured global rise in atmospheric temperature has been less than 1°C. But most of this increase occurred prior to 1940, and average planetary temperatures fell from around 1943 until about 1978, leading to a global cooling scare. Temperatures rose slightly until 1998, then mostly remained stable, even as carbon dioxide levels continued to rise. Rising CO2 levels and temperature variations do not correlate very well at all."
"[I]f industrial carbon dioxide did not cause recent global warming,
what did? A Danish research group, led by Prof. Henrik Svensmark,
has found a very credible match between levels of sunspot activity
(giant magnetic storms) on our Sun and global temperatures over
the last fifteen hundred years. This all-natural mechanism
actually fits the evidence! How terribly inconvenient for
alarmists.
"We in the developing world will no longer let climate truth be suppressed. We will not allow loud, radical activists to put the brakes on African economic development, jobs, and improved health and living standards, in the name of advancing their anti-human, wealth redistribution agendas." |
11-01-19 | Watts Up With That | |||||||||||||||||||||||||||||||||||||||||||||||||||||||||||||||||||
|
With complete predictability, the occurrence of any and every undesirable contemporary weather event is immediately blamed, by politicians and the media alike, upon global warming, concealed behind the new all-encompassing marketing term "climate change." Scientific evidence for these claims is no longer required. The recent flooding in Venice was no exception. For example, from the BBC we get: From USA Today: And From the Washington Post: These are just three examples of many. At 1.87m or just under 6'-2", this flooding is certainly devastating, but not historically unprecedented. In 1966 a worse flood occurred as reported in Wikipedia: "On November 4, 1966, an abnormal occurrence of high tides, rain-swollen rivers and a severe sirocco wind caused the canals to rise to a height of 194 cm or 6 ft 4in." Of course, this was back in the 1960s when "global cooling" and a coming ice age were the then Crisis du Jour. A lowering of sea levels would have been the result of those predictions, so the flooding was blamed on well established causes such as high tides, overflowing rivers and storms rather than the human release of CO₂. That would have to come later. Official flood recordkeeping only began in 1936, and from Venice's own website the following large floods are noted:
However, flooding has been a constant problem plaguing the city long before records began to be kept, as seen by comparing this current photo with the painting made by by Vincenzo Chilone of a flood from 1825. And unfortunately, not a single SUV or coal-fired power plant around back then, to blame.  San Marcos Square flooded 11-14-2019: Photo by REUTERS/Manuel Silvestri  San Marcos Square flooded 12-09-1825: Painting by Vincenzo Chilone The principle argument put forward to explain an increase in the frequency of Venice floods is that rising sea levels, due to global warming, are responsible. But as has been pointed out above here, here, here, here, here, here, here and here, that:
So what is responsible for the increasing Venetian flooding? Well, as for the November 14th flood, the Adriatic Sea was experiencing an exceptional lunar-driven high tide known as the aqua alta. The high water was further driven on shore by the sirocco winds, creating worse than usual conditions. This was then combined with an unusual storm which created river flooding in the region. In other words, the conditions were similar to those which created the 1966 record flood. As for the increased frequency of flooding, there is no mystery: Venice is sinking! Constructed on silt deposited by river deltas, building foundations were formed of wooden piles driven through the silt to a clay base below. Through natural settling as well as the withdrawing of ground water by way of artesian wells, the entire city has been subsiding for centuries. A peer-reviewed study relying on satellite data concluded that the Italian northern coastal plain was sinking at a rate of up to 1cm/year and the cumulative 1992-2010 subsidence exceeded 11cm. At that rate the drop over the next century would be around 61cm or two feet, far exceeding any anticipated sea level rise! This alone can easily explain why the frequency of flooding has increased over time. If climate alarmists wish to establish that sea level increases are a significant factor, they will have to do more than simply wave their hands and assert it. As a first good step, they could begin by presenting all the relevant facts, including the well established subsidence figures, when stating their position. Short of that, their claims are meaningless.
|
03-21-12 08-15-18 11-16-19 |
Live Science Science Direct Fox News |
|||||||||||||||||||||||||||||||||||||||||||||||||||||||||||||||||||
|
On November 11, 2019, the Proceedings of the National Academy of Sciences (PNAS) published a new peer-reviewed paper. The authors (Grinsted, Ditlevsen and Christensen) examined data for the normalized area-of-total-destruction damage estimates caused by hurricanes from 1900 to 2018 and concluded: "We find that hurricanes are indeed becoming more damaging. The frequency of the very most damaging hurricanes has increased at a rate of 330% per century." Meteorologist Roger Pielke reviewed these findings and determined that the report was "fatally flawed" as a result of a number of serious methodological errors, calling for it to be retracted. "If true, the paper (which I'll call G19, using its lead author's initial and year of publication) would overturn decades of research and observations that have indicated over the past century or more, there are no upwards trends in U.S. hurricane landfalls and no upwards trends in the strongest storms at landfall." "The first big problem with G19 is that it purports to say something about climatological trends in hurricanes, but it uses no actual climate data on hurricanes. That's right, it instead uses data on economic losses from hurricanes to arrive at conclusions about climate trends. The economic data that it uses are based on research that I and colleagues have conducted over more than two decades, which makes me uniquely situated to tell you about the mistakes in G19." [Emphasis added] Pielke points out that the hurricane counts used in the analysis do not agree with official NOAA records. The first half of the period under study is missing 25 hurricanes while the latter half includes an additional 64 storms not categorized as hurricanes. This looks like yet another usr of the typical climategate trick of forcing early data downward and later data upward in order to create the appearance of an increase that does not exist! Of even more importance is the state of the hurricane losses dataset maintained by ICAT. This data originally came from Pielke's own P08 methodology. However, in 2008 ICAT made major changes by replacing P08 data with that obtained from the NOAA National Centers for Environmental Information (NCEI). This created a hybrid dataset with a discontinuity at 1980 between the earlier P08 and the later NCEI data. The researchers then used the broken ICAT dataset, combined with the inaccurate hurricane counts, in order to generate erroneous conclusions that contradicted all other past observations. "The bottom line here is that a fatally flawed paper on climate science passed peer review at a significant journal. It used a dataset found online that had not undergone peer review, much less any quality control. The flawed conclusions of G19 have been loudly promoted by activist scientists and uncritical media. "The result has been a polluting of our discussions of climate science and policy. I have no doubt that good science will win out in the long run, but if we do not enforce basic standards of research quality along the way, we will make that battle much more difficult than it need be. Amen. |
11-15-19 | Forbes | |||||||||||||||||||||||||||||||||||||||||||||||||||||||||||||||||||
|
Another decade, another set of failed global warming predictions. As reported by ZeroHedge, for many years the public has been told by the many signs throughout the park, that all of the glaciers in Glacier National Park would be totally melted by the year 2020 because of man-made global warming. 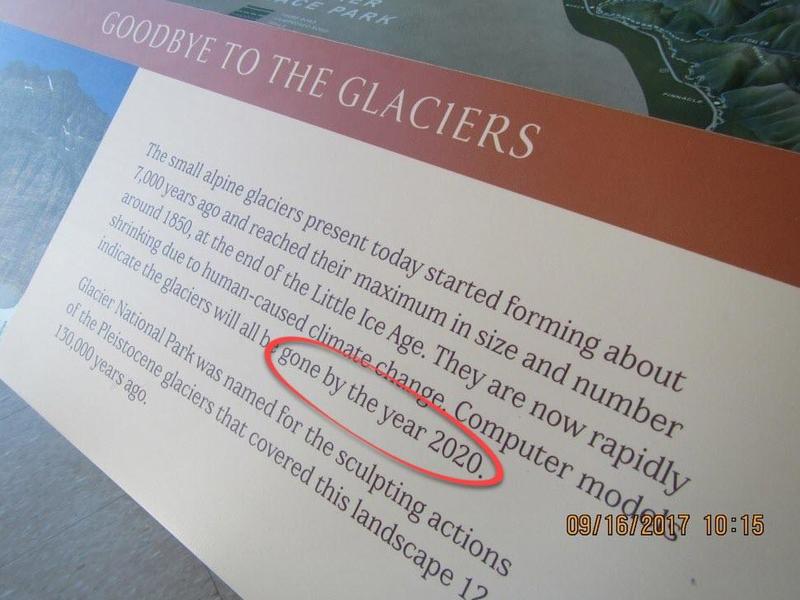 "[The glaciers] are now rapidly shrinking due to human-caused climate change. Computer models indicate the glaciers will all be gone by the year 2020." Well, unfortunately, man has once again failed to live up to the high standards mandated by the revered computer climate models and glaciers remain on display throughout the park. But don't worry, this is nothing that your tax dollars cannot fix. The Park Service has been busily replacing all of these plaques, brochures and videos with new versions informing us that: "When [the glaciers] will completely disappear, however, depends on how and when we act." You're still on the hook, but now it's an open-ended hook. ZeroHedge also reports: "Last year the Park Service quietly removed its two large steel trash cans at the Many Glacier Hotel which depicted 'before and after' engravings of the Grinnell Glacier in 1910 and 2009. The steel carvings indicated that the Glacier had shrunk significantly between the two dates. But a viral video published on Wattsupwiththat.com showed that the Grinnell Glacier appears to be slightly larger than in 2009." "The 'gone by 2020' claims were repeated in the New York Times, National Geographic, and other international news sources. But no mainstream news outlet has done any meaningful reporting regarding the apparent stabilization and recovery of the glaciers in [Glacier National Park] over the past decade." Remember kids, never let facts get in the way of a good manipulative narrative. [Note: This article was originally published back in June, but seemed more appropriate for kicking off the new decade.] |
01-01-20 | ZeroHedge | |||||||||||||||||||||||||||||||||||||||||||||||||||||||||||||||||||
|
Normal Sea Ice Extent At Both Poles Real Climate Science reports: "After fifteen years of nonstop propaganda about record heat and record polar melting, sea ice extent is normal both poles." These chart, from the National Snow and Ice Data Center, show the 2020 ice extent (blue line), falling within the ±2 standard deviations of norm (grey range). 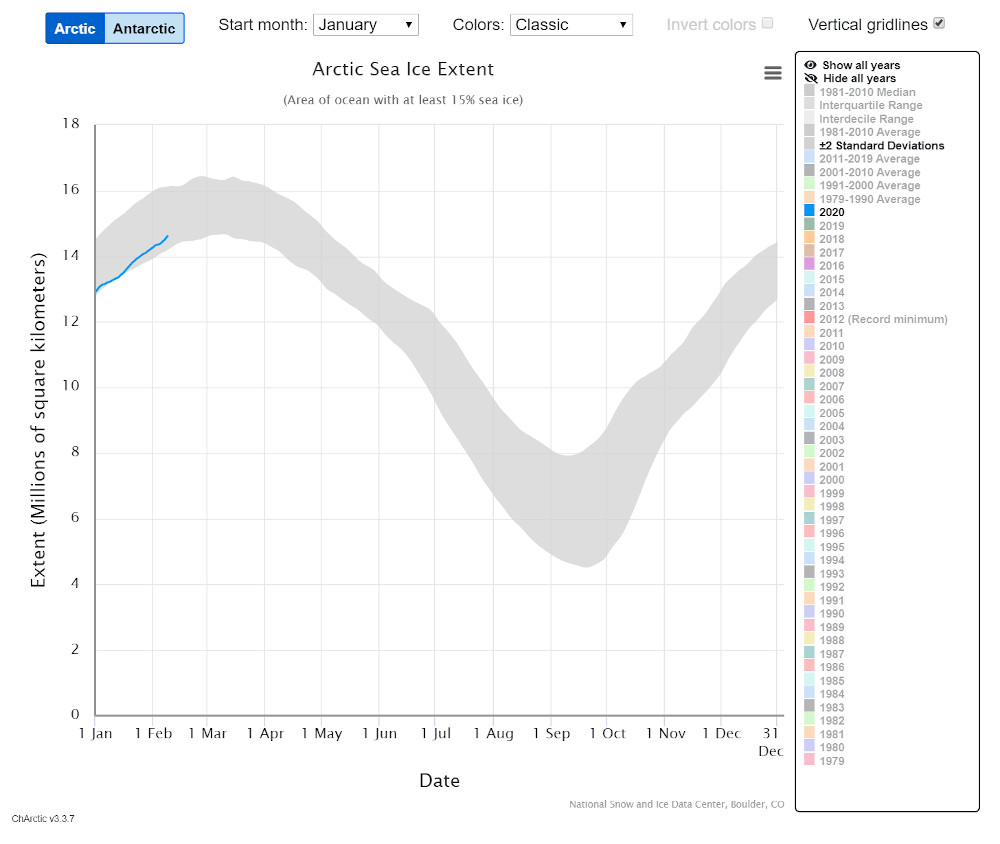 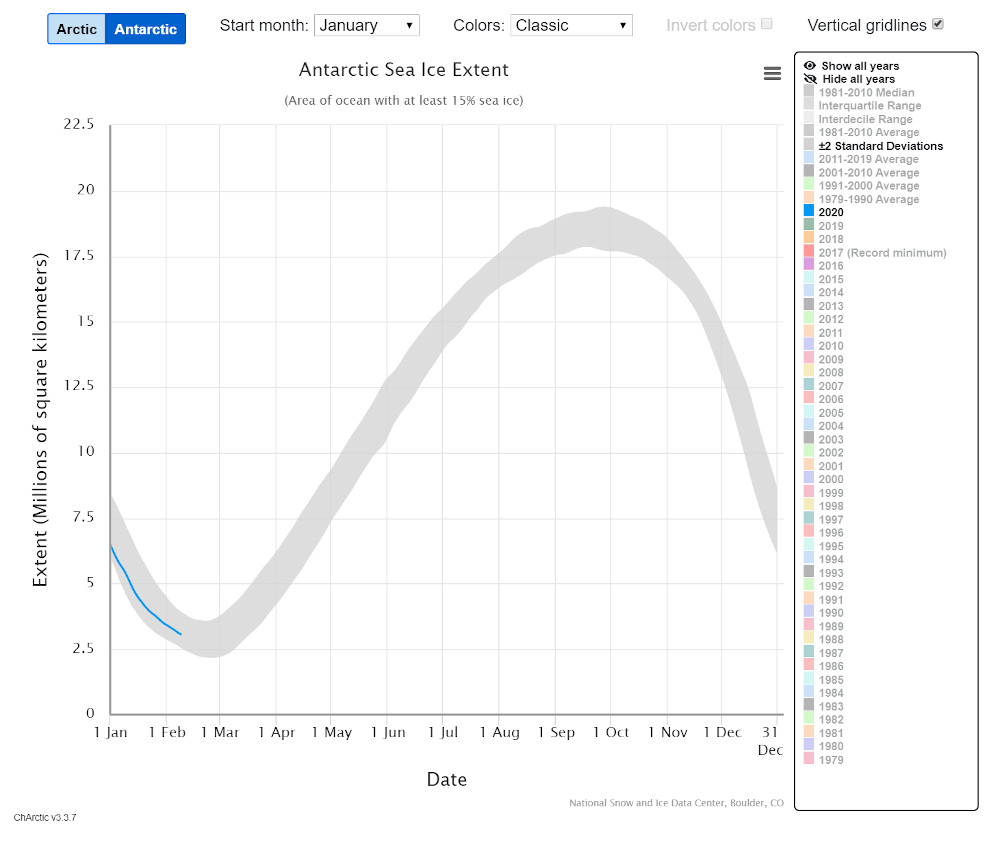 |
02-10-20 | Real Clear Science | |||||||||||||||||||||||||||||||||||||||||||||||||||||||||||||||||||
|
On Behalf Of Environmentalists, I Apologize For The Climate Scare
Shellenberger then published a companion article on Forbes that broadly summarized the misinformation that has been disseminated by environmentalists, politicians and the press in this arena. After appearing on their website for just a few hours, Forbes censored it. Fortunately other sites such as Quillette and ZeroHedge have made it available. Below is a summary of some of the more interesting points.
"On behalf of environmentalists everywhere, I would like to formally apologize for the climate scare we created over the last 30 years. Climate change is happening. It's just not the end of the world." "Here are some facts few people know: "I know that the above facts will sound like "climate denialism" to many people. But that just shows the power of climate alarmism." "Some highlights from the book: "Why were we all so misled?" "In the final three chapters of Apocalypse Never I expose the financial, political, and ideological motivations. Environmental groups have accepted hundreds of millions of dollars from fossil fuel interests. Groups motivated by anti-humanist beliefs forced the World Bank to stop trying to end poverty and instead make poverty "sustainable." And status anxiety, depression, and hostility to modern civilization are behind much of the alarmism." "Scientific institutions including the World Health Organisation and IPCC have undermined their credibility through the repeated politicization of science." So what we have here is an honest environmentalist who actually respects the scientific method and the truth. Much of what he reports here is confirmed by the past work of scientists recorded above, but it forms a good summarization and is a welcome voice standing against the politicization of science and the anti-civilization forces at work. |
06-30-20 | Quillette | |||||||||||||||||||||||||||||||||||||||||||||||||||||||||||||||||||
|
Facts cannot be allowed to stand in the way of "truth!" When pesky history is interfering with your story, well, just do what all regimes do: rewrite history. As reported by Jennifer Marohasy on her website:
"The Australian Bureau of Meteorology deleted what was long
regarded as the hottest day ever recorded in Australia —
Bourke's 125°F (51.7°C) on the 3rd January 1909. This
record was deleted, falsely claiming that this was likely some
sort of 'observational error', as no other official weather
stations recorded high temperatures on that day.
"That the Bureau of Meteorology denies these record hot days is a travesty. Is it because these records contradict their belief in catastrophic human-caused global warming?" "Not only has Mr Kelly MP tracked-down the meteorological observations book for Brewarrina, but over the last week he has also uncovered that 51.1°C (124°F) was recorded at White Cliffs for Wednesday 11th January 1939. This is the second hottest ever!" "If global warming is indeed the greatest moral issue of our time, then every Australian regardless of their politics and their opinion on greenhouse gases and renewable energies, must be honest to history and these truths." |
07-10-20 | Jennifer Marohasy | |||||||||||||||||||||||||||||||||||||||||||||||||||||||||||||||||||
|
Some interesting facts from an article titled: What Happened to Summer? "Summer came to an abrupt end in the mountains of northern Spain last weekend when a sudden cold snap left the Picos de Europa range buried under a blanket of white. The Alps and Pyrenees have recently received heavy summer snow, and now the French are reporting all-time record August lows. And we have strong upticks in the ice in Greenland and in Antarctica where the ice this year is greater than that on the same date in 1979, as well as on the same date in every year of the 1980s and 1990s (barring 1985, 1994, 1998, and 1999)." "Greenland gained a record-smashing four gigatons of snow and ice," "Norway also suffered its 'Coldest Summer for 60 Years'" "Several cold records shattered in The Netherlands in July, where it has never been colder since the start of the measurements." Of course this is merely weather. Climate only happens when the data goes in the other direction. |
09-03-20 | Dr Sircus | |||||||||||||||||||||||||||||||||||||||||||||||||||||||||||||||||||
|
From today's "It's funny 'cause it's true" files, we have an article in the Wall Street Journal titled: Behind the Rise of U.S. Solar Power, a Mountain of Chinese Coal. Here are a few observations from the article:
"Solar panel installations are surging in the U.S. and Europe as
Western countries seek to cut their reliance on fossil fuels.
"For years, China's low-cost, coal-fired electricity has given the
country's solar-panel manufacturers a competitive advantage,
allowing them to dominate global markets.
"Producing a solar panel in China creates around twice as much carbon dioxide as making it in Europe, said Fengqi You, professor of energy systems engineering at Cornell University" And the not all that surprising conclusion? "'If China didn't have access to coal, then solar power wouldn't be cheap now,' said Robbie Andrew, a senior researcher at the Center for International Climate Research in Oslo." [Emphasis added] |
07-31-21 | WSJ | |||||||||||||||||||||||||||||||||||||||||||||||||||||||||||||||||||
|
In the following video titled, Extreme Fraud At NOAA And NASA, Tony Heller summarizes a number of old and new tricks being used to manipulate the temperature dataset by these government organizations in order to falsely back up claims about climate change. Here is a summary of some of the more important points raised by Heller:
|
08-02-21 |
YouTube Video
YouTube |
|||||||||||||||||||||||||||||||||||||||||||||||||||||||||||||||||||
|
In a follow-up to his NOAA/NASA temperature data manipulation report above, Tony Heller shows how these tricks are used by NOAA to lie and state that July 2021 was the Hottest Month Ever. Read the report or listen to this 7:21 minute video presentation. |
08-18-21 |
Real Climate Science
YouTube |
|||||||||||||||||||||||||||||||||||||||||||||||||||||||||||||||||||
|
Let's put things into perspective ... 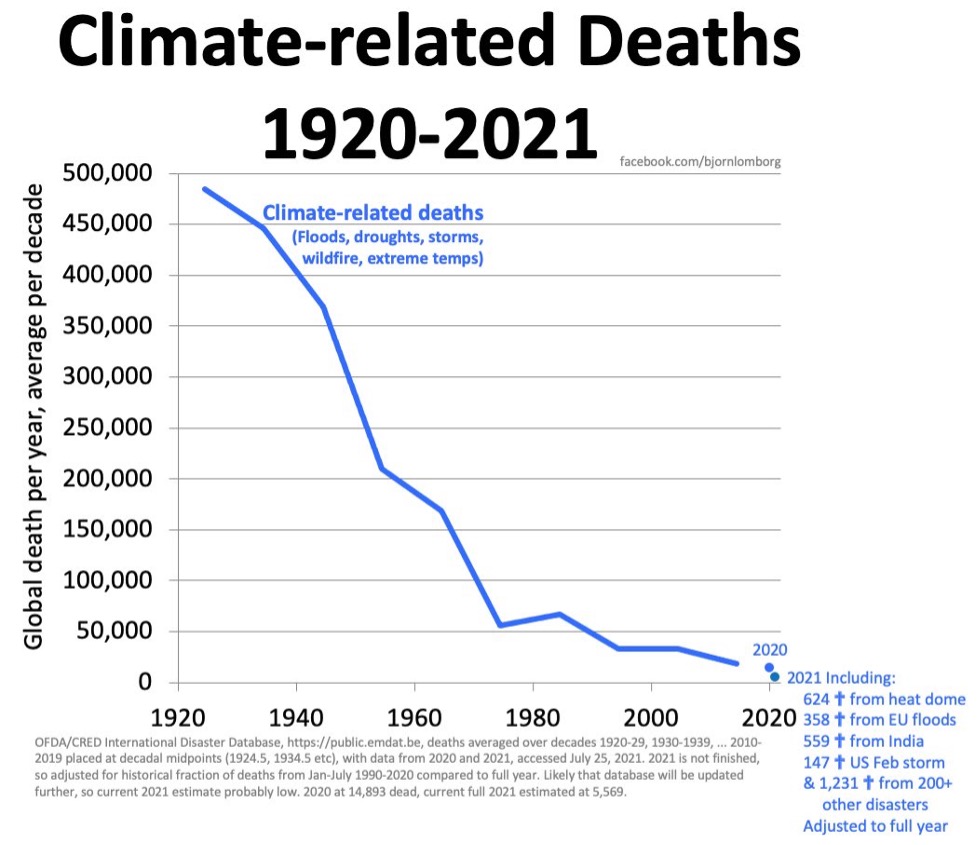 As reported by Gale Pooley in an article titled The Collapse of Climate-Related Deaths, a study by Danish environmentalist Bjorn Lomborg shows that: "So, adjusted for population, we went from 255.3 deaths per million in 1920 to 1.9 per million in 2020, a 99.25 percent decrease. In other words, for every climate-related death in 2020, we had 133.6 deaths in 1920."
"The above numbers suggest that between 1920 and 2020, the world
has become 13,260 percent safer from climate-related death (i.e.,
around 5 percent safer a year). Lomborg notes:
This is quite a remarkable achievement! |
09-03-21 | Human Progress | |||||||||||||||||||||||||||||||||||||||||||||||||||||||||||||||||||
|
Well it's snowing in California and Hawaii again and there was a tornado in Kentucky, so business as usual for people who have a reasonable perspective on the state of the world. But not for everyone. In this article, Anthony Watts does a good job of putting the recent tornado into context, demonstrating with the government's own data that this is far from the "worst" in American history and that: "While there's an upward trend in all tornadoes — due to increased reporting courtesy of millions of cellphone cameras, storm chasers, and expanding populations — violent tornadoes rated EF3 or greater, like the one in Kentucky, are down significantly." 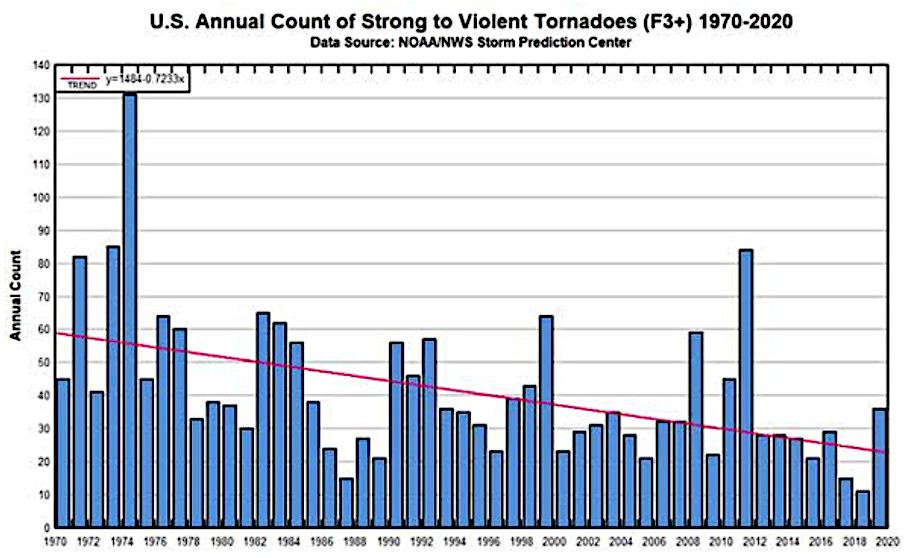 |
12-15-21 | American Thinker | |||||||||||||||||||||||||||||||||||||||||||||||||||||||||||||||||||
|
In an article titled Temps should be 'slowly growing warmer, not colder' amid southern summer, the following is reported: "Neptune's southern hemisphere has spent the last 17 years in its summer season, yet global temperatures have plummeted. It's a head-scratching finding that leaves astronomers with more questions than answers." "Researchers actually know very little about Neptune's seasons, taking place over its 165-year orbit of the sun. They say the temperature variations could be linked to seasonal changes in Neptune's atmospheric chemistry. As the paper notes, per ScienceAlert, 'photochemically produced hydrocarbons — primarily ethane and acetylene — are powerful infrared emitters that serve to cool the stratosphere.' But the changes observed between 2018 and 2020 'appear surprisingly swift for seasonal response.'" Of course, climate variability happening on other planets does not directly explain what happens on Earth, but as previously reported here, when there is a correlation in temperature rise on multiple planets, likely due to the sun, it is conveniently ignored. And when unexpected climate changes occur elsewhere as seen here, since man is inconveniently absent, natural factors are investigated — something often minimized when AGW supporters attempt to explains Earth's own variability. Here is a link to the article in The Planetary Science Journal: Subseasonal Variation in Neptune's Mid-infrared Emission |
04-12-22 | Newser | |||||||||||||||||||||||||||||||||||||||||||||||||||||||||||||||||||
|
Thomas A. Troszak appears to have published a whitepaper in April of 2021 through the NATO Energy Security Centre of Excellence (ENSEC COE), titled: The Hidden Costs of Solar Photovoltaic Power [PDF]. Here is an excerpt from the introduction: "Despite many optimistic predictions, solar photovoltaic (solar PV) power still represents only a small fraction of the global electricity supply as of 2020. More than two decades of near-exponential growth and investment in solar PV development have taken place, yet the amount of fossil fuels being burned for power is still increasing. This apparent paradox has been attributed to a variety of economic or political issues, but a critically important factor may be missing from the discussion. "All modern technologies are dependent upon the supply of fossil fuels and fossil energy that made them possible. Similarly, every step in the production of solar PV requires an input of fossil fuels — as raw materials, as carbon reductants for silicon smelting, for process heat and power, for transportation, and for balance of system components. Regardless of any intentions, no quantity of banknotes or any number of mandates can yield a single watt of power unless a significant expenditure of raw materials and fossil energy takes place as well. "Therefore, the author of this article invites all interested parties including environmentalists, consumers and policy makers to consider the wider environmental impact, and the great debt of resources that actually must be paid before a PV system can be installed at any utility, workplace, or home. If we wish to recognize the hidden costs of this highly engineered industrial technology, we must first examine the non-renewable reality of the PV manufacturing process itself. To be even more realistic, we must also consider the additional consequences resulting from the fossil-fuel- powered global supply chains that are necessary for the mining, production, and implementation of PV power systems." Troszak then proceeds to discuss the carbon-based energy-intensive processes used in the refining of required materials and the manufacturing and distribution of solar panels. It is important to have a realistic understanding of the true energy costs when evaluating proposed energy replacements such as this. Read the paper as it is filled with many interesting details. |
06-12-22 | NATO ENSEC COE | |||||||||||||||||||||||||||||||||||||||||||||||||||||||||||||||||||
|
Climate alarmists have been getting predictions regarding hurricanes wrong for a long long time, as previously reported: here, here, here, here, here, here, here, here, and here. A recent study [PDF] published in the January 2022 issue of Marine Geology, discusses the historical record of hurricanes in the Bahamas, as recorded by sediment deposits in Hine's Blue Hole on Cay Sal Bank. From the abstract: "Hine's Hole has an accumulation rate of 2-3.2 cm/yr, making it among the highest-resolution hurricane reconstructions to date. Unlike many paleo-hurricane reconstruction sites, Hine's Hole is not surrounded by coastal landmasses that can dampen currents and waves produced by hurricanes, so it archives most ≥Category 1 hurricanes passing within 115 km during the 170-year instrumental record (1850 CE-present) and may also document intense tropical or winter storms. Hine's Hole archives ~16 intense storms per century from 1850 to 2016 CE, but documents three periods from 1505 to 1530 CE, 1570 to 1620 CE, and ~ 1710 to 1875 CE with over twice as many intense storms per century. ... As such, this reconstruction provides unprecedented insight into changes in hurricane activity within the pre-industrial climate system and demonstrates that recurrence intervals based on the 170-year instrumental record can severely underestimate the threat hurricanes pose certain localities." As summarized in a recent Hakai Magazine Article: "The evidence that hurricane activity is at a historical low is hiding on the Caribbean seafloor." [Emphasis added] "'Over the last 170 years, we've had about five hurricanes per century on average,' Winkler says of the local record from Hine's Hole. 'But the rate has been almost eight times that in the past.'" [Emphasis added] 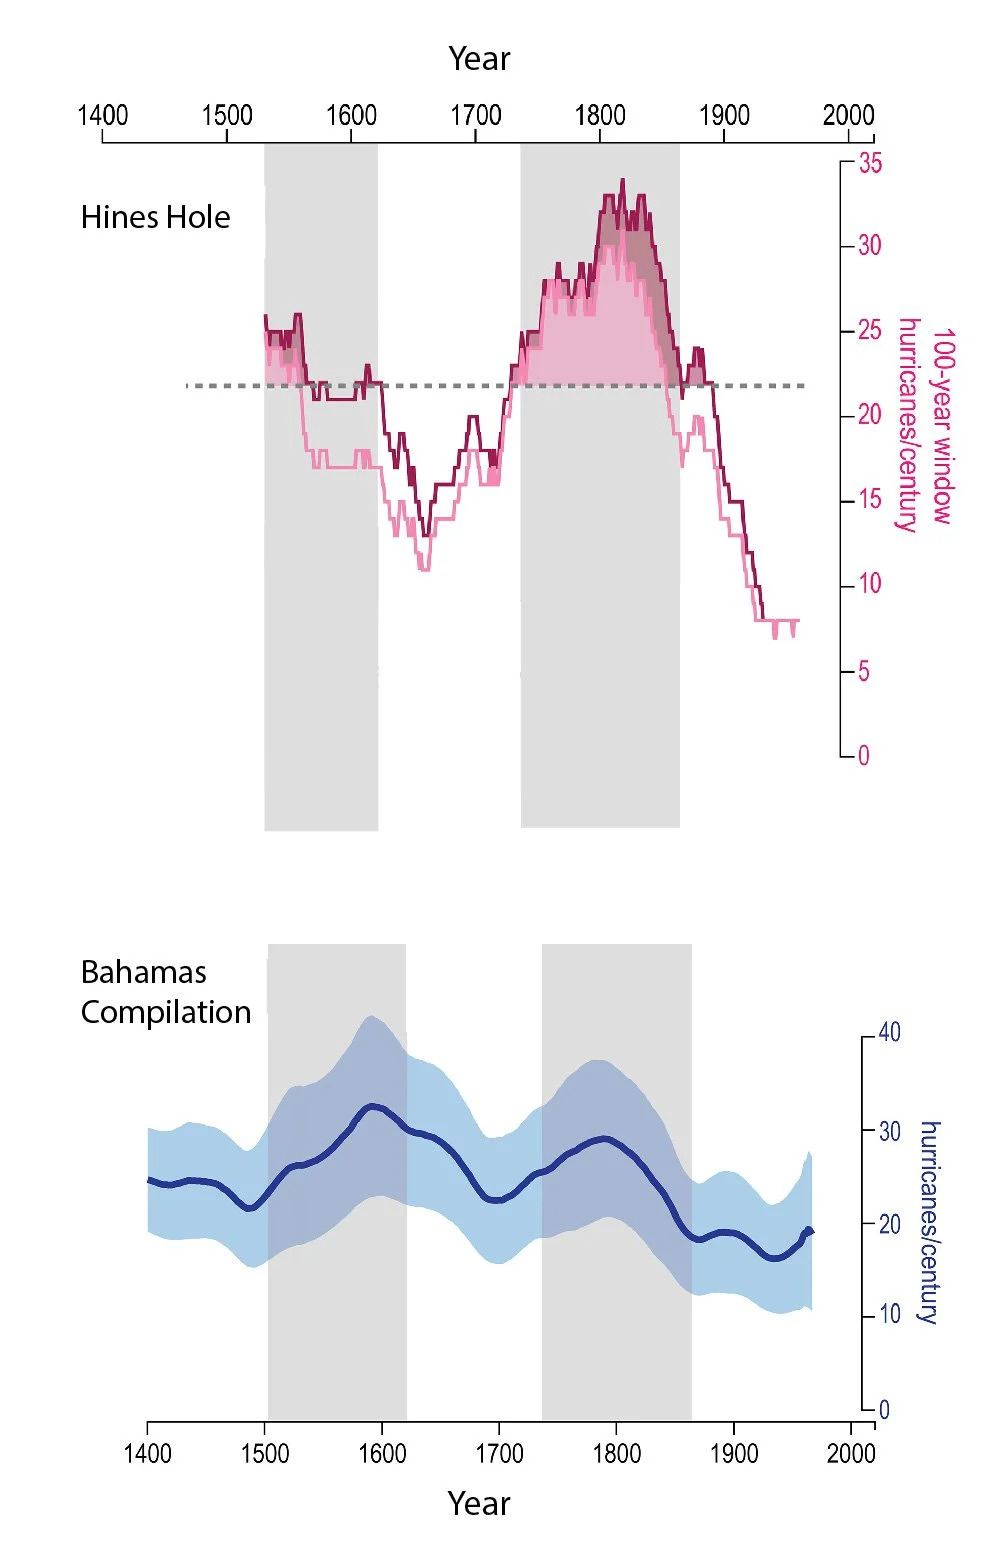
As shown, like many other natural phenomenon, hurricane frequency and severity vary in a periodic fashion over time. Whatever conclusions can be drawn from this data, it is clear that man's industrialization efforts over the 20th and 21st centuries have not been a driving factor. |
01-01-22
06-08-22 |
Marine Geology
Hakai Magazine |
|||||||||||||||||||||||||||||||||||||||||||||||||||||||||||||||||||
|
As reported by CarbonBrief, "Climate change has driven a 13% decline in the frequency of tropical cyclones since pre-industrial times, new research finds." The original research paper can be found here. "The findings show a 13% decrease in tropical cyclones around the world between 1850-1900 and 1900-2000. More specifically, they find a drop from more than 100 tropical cyclones a year in pre-industrial times to around 80 in 2012. The study does not look at changes in the intensity — or damage — of cyclones over this period." "Chand tells Carbon Brief that in past research on tropical cyclone frequency, there have been 'different trends noted in different studies' due to the high natural variability. This paper is novel, he says, because 'now we have got a long-term data set to properly remove the effects of natural variability and other external factors that may be affecting the trend.'" "The North Atlantic is the one region to show an increase in tropical cyclone frequency in recent decades, bucking a declining trend in the first half of the 20th century. The study suggests two main reasons for this result. First, it points to a persistent positive (warm) phase of the naturally occurring Atlantic Multidecadal Oscillation (AMO), which could be improving conditions for cyclone formation. Second, the passing of the US Clean Air Act in the 1970s saw pollution levels drop significantly, causing further localised warming. Nonetheless, the authors find that tropical cyclone numbers averaged over 1900-2000 were around 28% lower than during the 1850-1900 baseline period." | 07-27-22 |
CarbonBrief
Science Direct |
|||||||||||||||||||||||||||||||||||||||||||||||||||||||||||||||||||
|
Tonga Eruption Blasted Unprecedented Amount of Water Into Stratosphere On January 15, 2022, an unusual underwater volcanic eruption near the island of Hunga Tonga sending about 146 teragrams of water vapor — equivalent to the volume of 58,000 Olympic-size swimming pools — into the stratosphere. This was equal to 10% of the water vapor already there. As water vapor is a significant greenhouse gas, this was a mechanism for increased earth temperatures. Here are some of the NASA observations from the article: "The excess water vapor injected by the Tonga volcano [...] could remain in the stratosphere for several years." "This extra water vapor could influence atmospheric chemistry, boosting certain chemical reactions that could temporarily worsen depletion of the ozone layer. It could also influence surface temperatures." This video shows the satellite image of the eruption captured by NASA.
|
08-02-22 | NASA | |||||||||||||||||||||||||||||||||||||||||||||||||||||||||||||||||||
|
Remember the 16-year pause in global warming that occurred between 1997 and 2012, reported here? Well, we are currently experiencing a new pause that has been now exceeded eight years and four months, as reported by Christopher Monckton in the article titled: The New Pause Lengthens: 100 Months with No Warming At All. 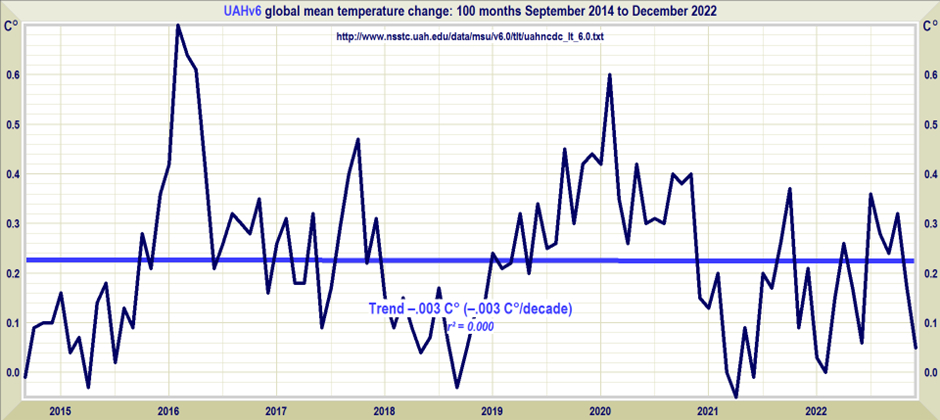 As Monckton reminds us: "[T]he Pause graph does not constitute a prediction: it simply reports the longest period, working back from the present, during which the temperature trend is not positive." He then follows this up with the graph showing the total global warming trend from December 1978 through December 2022 which indicates a total warming of 0.591° C (1.064° F) which is equal to 0.134° C (0.241° F) per decade. 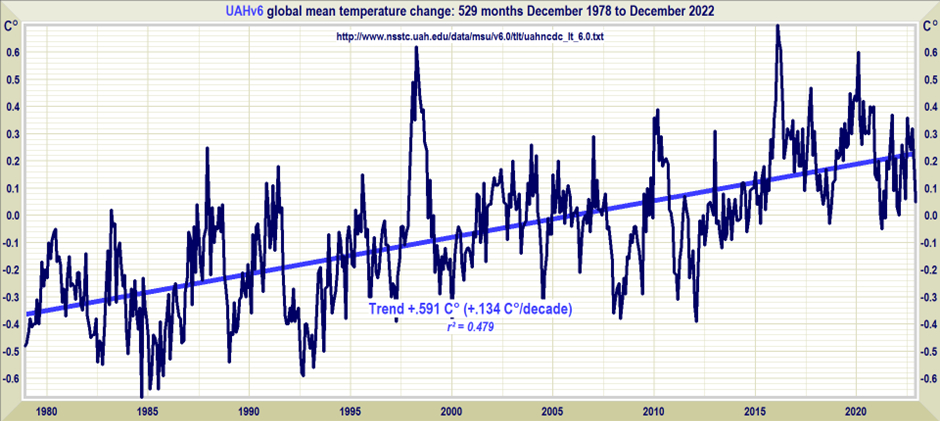 As Monckton points out, the actual results continue to demonstrate the failure of the IPCC predictions. See the article for details. |
01-04-23 | Watts Up With That? | |||||||||||||||||||||||||||||||||||||||||||||||||||||||||||||||||||
|
Hottest Day Ever? Don't Believe it 'Average global temperature' is a meaningless measure, and comparisons to 125,000 years ago are preposterous. Steve Milloy reviews the recent claims that July 3rd and 4th were the hottest days on record. Here are the facts.
"The global-warming industry has declared that July 3 and 4 were
the two hottest days on Earth on record. The reported average
global temperature on those days was 62.6 degrees Fahrenheit,
supposedly the hottest in 125,000 years. The claimed temperature
was derived from the University of Maine's Climate
Reanalyzer, which relies on a mix of satellite temperature
data and computer-model guesstimation to calculate estimates
of temperature.
As has been the case stretching back to at least 2009 and the revelations from the original East Anglia Climategate scandal, computer models can be rigged to produce desired outcomes and are completely suspect when they do not square up with real-world data. Additionally, why are no climate alarmists or media reports referencing the fully anticipated temperature increases due to the 2022 Tonga volcanic eruption that are likely to remain in effect for a few years? Draw your own conclusions. |
07-07-23 | Wall Street Journal | |||||||||||||||||||||||||||||||||||||||||||||||||||||||||||||||||||
|
The Censoring of Nobel-Winning Physicist Dr. John Clauser As reported in The Daily Sceptic (DS) and by Joanne Nova, Nobel Physics Laureate Dr. John Clauser is being "canceled" for his views on climate change. As DS reports: "Earlier this month, the 2022 Nobel Physics Laureate Dr. John Clauser slammed the 'climate emergency' narrative as a 'dangerous corruption of science that threatens the world's economy and the well-being of billions of people'. Inevitably, the punishments have begun. A talk that Dr. Clauser was due to give to the International Monetary Fund on climate models has been abruptly cancelled, and the page announcing the event removed from the IMF site. "Dr. Clauser was due to speak to the IMF's Independent Evaluation Office this Thursday under the title: 'Let's talk – How much can we trust IPCC climate predictions?' It would appear that 'not a lot' isn't the politically correct answer. Clauser is a longstanding critic of climate models and criticised the award of the Physics Nobel in 2021 for work on them. He is not alone, since many feel that climate models are primarily based on mathematics, and a history of failed opinionated climate predictions leave them undeserving of recognition at the highest level of pure science. ..." "Last week, Clauser observed that misguided climate science has 'metastasised into massive shock-journalistic pseudoscience'. This pseudoscience, he continued, has become a scapegoat for a wide variety of other related ills. It has been promoted and extended by similarly misguided business marketing agents, politicians, journalists, government agencies and environmentalists. 'In my opinion, there is no real climate crisis,' he added. "Clauser is the latest Nobel physics laureate to dismiss the notion of a climate crisis. Professor Ivar Giaever, a fellow laureate, is the lead signatory of the World Climate Declaration that states there is no climate emergency. It further argues that climate models are 'not remotely plausible as global policy tools'. The 1998 winner Professor Robert Laughlin has expressed the view that the climate is 'beyond our power to control' and humanity cannot and should not do anything to respond to climate change." And as Jo Nove observes: "Dr John F Clauser of quantum entanglement fame, leaves no doubt about his thoughts: '...climate science has metastasized into massive shock-journalistic pseudoscience'. "Despite that, the ABC and BBC types won't pick up the phone to ask Dr John F Clauser why a man with his remarkable reputation would risk looking like an idiot, and speaking up as a climate skeptic. It's not that they are afraid he might bore the audience or sound like a kook. They won't ask him because they're afraid he'll have a good answer." "How much damage would it do to the cause if the audience finds out that one of the highest ranking scientists in the world disagrees with the mantra? It would break that sacred spell. Suddenly, the unwashed masses will realize 'there is a debate', and that all the times they were told 'the debate was over', they were being lied too." "The same team that tells us that we must 'listen to the experts', won't listen to any experts they don't like. They rave about 'UN Experts' that hide the decline, but run a mile to avoid the giants of science. They'll ask high school dropouts about climate change on prime time TV before they interview the Nobel Prize winners. It's a lie by omission. It's active deception. And the whole climate movement is built on it." |
07-13-23 07-23-23 |
JoNova The Daily Sceptic |
|||||||||||||||||||||||||||||||||||||||||||||||||||||||||||||||||||
|
Data Misrepresentation Continues at the Highest Levels Scientific institution after institution continue to destroy their credibility by manipulating data in service of propping up the political agenda of anthropogenic global warming. Here is an example from The Lancet, a weekly UK medical journal. In Volume 7, Issue 4, dated April 2023, under the heading of "Planetary Health," they published and article by Pierre Masselot, PhD, Malcolm Mistry, PhD, et al, titled: The study was funded by:
the UK's Natural Environment Research Council (NERC) the EU's Horizon 2020 the EU's Joint Research Center. Here are some excerpts from the opening Summary and Introduction: "Heat and cold are now established health risk factors, [...] The associated health burden is expected to increase with climate change, especially under the most extreme scenarios of global warming." "Around 40% of the EU population lives in cities of at least 50,000 inhabitants and the urban population experiences overall higher levels of temperature stress, particularly heat. [...] Better knowledge of the city-level mortality effects of climate change-related stressors is crucial for the design and implementation of adaptation policies." "The objective of the present study is to provide a comprehensive and consistent assessment of the current mortality burden associated with non-optimal temperature across most European cities [...] The model and results can be applied for projections in future climatic conditions, accounting for shifts in the age distribution and various socioeconomic scenarios, and eventually be used to design adaptation policies". [Emphasis added] There is no ambiguity that heat, not cold is the real focus of the study, and that it is intended for purposes of supporting future governmental environmental policies, which is no surprise given who paid for it. That said, let's skip to the following chart that summarizes their findings concerning excess deaths attributed to cold and heat. 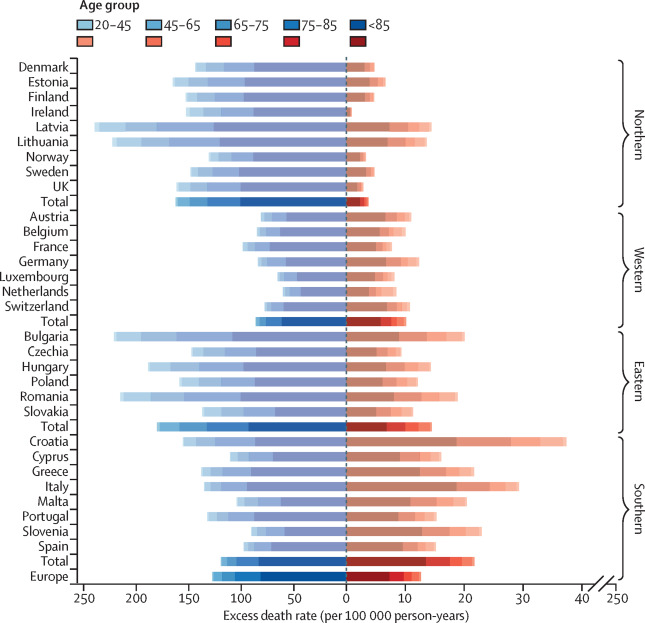 Take a close look. Notice anything strange? Well, Gregory Wrightstone did. As he reported in the Climate Change Dispatch, the scale for the cold side of the chart runs between 0-250 while the scale for the heat side is 0-40 over five times larger, which significantly magnifies the impact of heat deaths vs. cold deaths. Here are the two modified charts that Wrightstone constructed to illustrate the point. 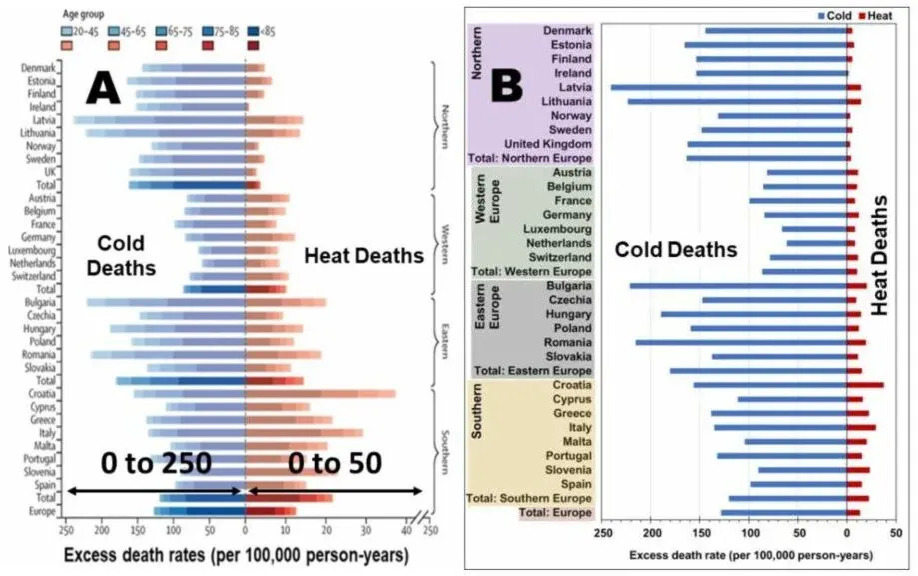 When the scales are equalized as is the case in the right chart, it becomes obvious that excess deaths from cold are a much greater problem than those from heat. However, that doesn't look too good when your narrative is all about human-caused warming, so the data has to be manipulated to tell the right story — facts, truth, and human lives be damned! Now, getting back to The Lancet, let's remember that this is a peer-reviewed journal. This supposedly "scientific" article passed through the review process of other professionals in the field in addition to the journal's editors without any flags being raised over this presentation of the data? This points to wide-spread corruption in the profession as well as the journal itself, calling into question everything that The Lancet publishes while destroying its reputation for scientific integrity. |
07-27-23 | Climate Change Dispatch | |||||||||||||||||||||||||||||||||||||||||||||||||||||||||||||||||||
|
As discussed frequently above, data manipulation is one method the climate alarmists use in order to fabricate the desired narrative when the simple facts will not comply. More recently the manipulation of graphics is being used in order to generate fear. Retired British scientist Don Keller recently posted the following image on Twitter showing two screen shots of televised European weather reports from 2017 (top) and 2022 (bottom). Note how much more severe the heat is in the bottom image! Except for the small fact that all the temperatures are much lower. 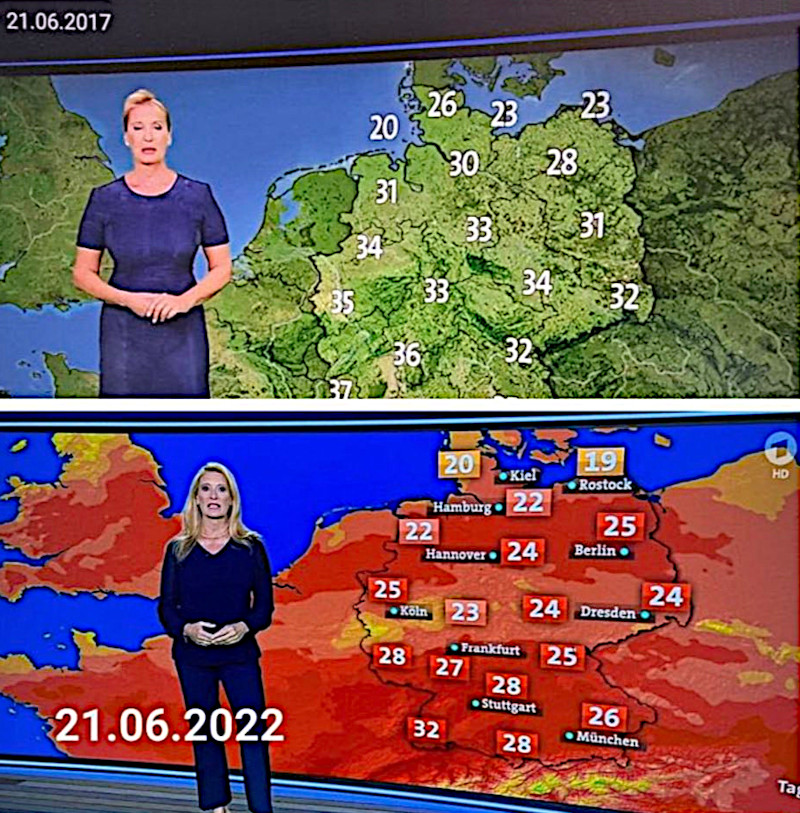 This is far from a one-time occurrence. For example, George Mason University maintains a Weather and Climate Data site. On August 1, 2023, this image was displayed on their home page: 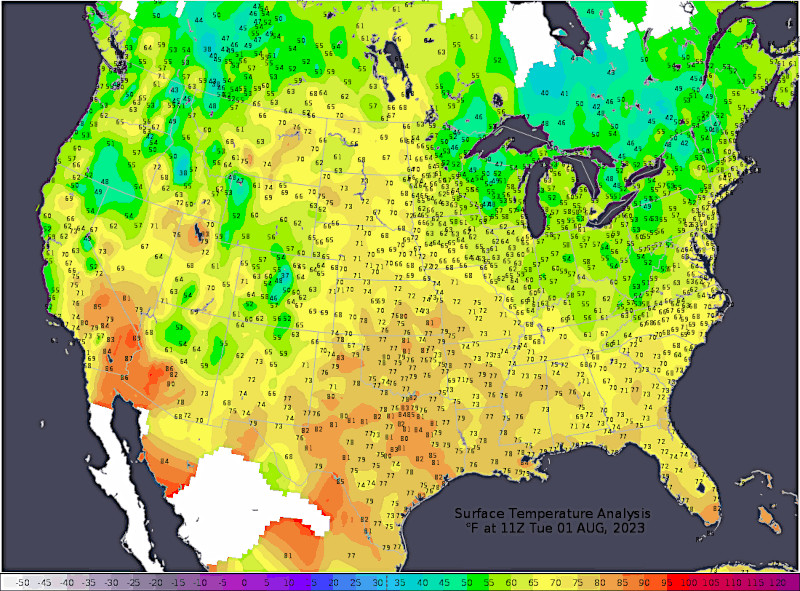 This is a reasonable map with yellow depicting temperatures from 65–79°F, orange from 80-89°F, and red 90°F and above. However, at the same time they had the following chart displaying temperature forecasts with a completely different visual scale: 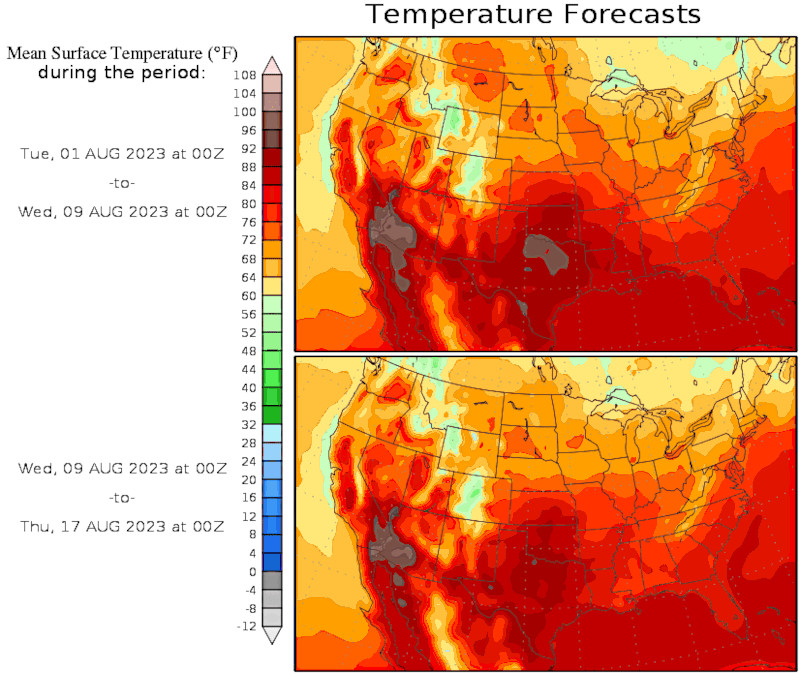 Here the yellow zone is compressed down to 60-63°F, orange 64-71°F, while red starts at a very comfortable 72°F. These are not arbitrary or accidental changes, but intentional ones made for the purpose of generating an overall impression of crisis in the face of data that conveys no such meaning. |
08-01-23 | George Mason University | |||||||||||||||||||||||||||||||||||||||||||||||||||||||||||||||||||
|
New Study Suggests Global Warming Could be Mostly an Urban Problem A team of 37 researchers has published a peer-reviewed paper in the journal, Climate, which highlights two important conclusions:
From the review: "It is well-known that cities are warmer than the surrounding countryside. While urban areas only account for less than 4% of the global land surface, many of the weather stations used for calculating global temperatures are located in urban areas. For this reason, some scientists have been concerned that the current global warming estimates may have been contaminated by urban heat island effects. In their latest report, the IPCC estimated that urban warming accounted for less than 10% of global warming. However, this new study suggests that urban warming might account for up to 40% of the warming since 1850." [Emphasis added] and: "The study also found that the IPCC's chosen estimate of solar activity appeared to have prematurely ruled out a substantial role for the Sun in the observed warming. "When the authors analysed the temperature data only using the IPCC's solar dataset, they could not explain any of the warming since the mid-20th century. That is, they replicated the IPCC's iconic finding that global warming is mostly human-caused. However, when the authors repeated the analysis using a different estimate of solar activity — one that is often used by the scientific community — they found that most of the warming and cooling trends of the rural data could actually be explained in terms of changing solar activity." [Emphasis added] The lead author of the study, Dr. Willie Soon states: "For many years, the general public has been assuming that the science on climate change is settled. This new study shows that this is not the case." |
08-28-23 09-02-23 |
Climate Watts Up With That? |
|||||||||||||||||||||||||||||||||||||||||||||||||||||||||||||||||||
|
Yes, temperature data showed a larger than normal temperature increase during 2023, and of course, the general media was quick to jump on this as conclusive proof that man-made CO2 was responsible. Here were a few typical headlines: The state of the climate in 2023 "In its last report in 2021, the Intergovernmental Panel on Climate Change (IPCC) warned that human activity is changing the climate in unprecedented and sometimes irreversible ways." — BBC: 03-19-23 [Emphasis added] Earth is on track for catastrophic warming, U.N. warns "Cut emissions quickly to save lives, scientists warn in a new U.N. report" — NPR: 03-20-23 [Emphasis added] Global heat in 'uncharted territory' as scientists warn 2023 could be the hottest year on record "And they are not holding back — "extraordinary," "terrifying" and "uncharted territory" are just a few of the ways they have described the recent spike in global temperature. ... As the world burns fossil fuels and pumps out planet-heating pollution, global temperatures are steadily warming." — CNN: 07-08-23 [Emphasis added] World is dangerously close to a global warming limit as 2023 goes down as hottest on record "The unprecedented heat in 2023 was caused primarily by climate change, Copernicus said, but was exacerbated by El Niño, a natural climate variability that increases Pacific Ocean heat and typically boosts the world's temperatures." — CNN: 01-09-24 [Emphasis added] After laying the blame mostly on man-made climate change, it was refreshing to see CNN at least make mention of the possible contribution from El Niño. A paper published on 10-10-24 by the European Geosciences Union (EGU) titled: The 2023 Global Warming Spike Was Driven By the El Niño–Southern Oscillation concludes that the naturally occurring El Niño–Southern Oscillation can fully explain the recent temperature rise. From the Abstract: fully "Global-mean surface temperature rapidly increased 0.29± 0.04 K from 2022 to 2023. Such a large interannual global warming spike is not unprecedented in the observational record, with a previous instance occurring in 1976–1977. However, why such large global warming spikes occur is unknown, and the rapid global warming of 2023 has led to concerns that it could have been externally driven. Here we show that climate models that are subject only to internal variability can generate such spikes, but they are an uncommon occurrence (p = 1.6% ± 0.1%). However, when a prolonged La Niña immediately precedes an El Niño in the simulations, as occurred in nature in 1976–1977 and 2022–2023, such spikes become much more common (p = 10.3% ± 0.4%). Furthermore, we find that nearly all simulated spikes (p = 88.5% ± 0.3%) are associated with El Niño occurring that year. Thus, our results underscore the importance of the El Niño–Southern Oscillation in driving the occurrence of global warming spikes such as the one in 2023, without needing to invoke anthropogenic forcing, such as changes in atmospheric concentrations of greenhouse gases or aerosols, as an explanation." [Emphasis added] And thus, once again, the so called "settled science" of anthropogenic global warming is shown to be very far from settled, and the alarmism generated by the popular press is nothing more than propaganda pushing a political narrative that is seen, over and over, to have very little to do with reality. |
10-10-24 | EGU Paper | |||||||||||||||||||||||||||||||||||||||||||||||||||||||||||||||||||
|
Floating Solar Can Increase Greenhouse Gas Emissions Science X (phys.org) published a report titled, Floating Solar Can Increase Greenhouse Gas Emissions. Study Finds. As is typically concerning work in the climate arena, investigations are primarily done using computer models. From the report: "While floating solar—the emerging practice of putting solar panels on bodies of water—is promising in its efficiency and its potential to spare agricultural and conservation lands, a new experiment finds environmental trade-offs." [...] "'There have been a flurry of papers about floating solar, but it's mostly modeling and projections,' said Steven Grodsky" Politicians rush ahead to mandate this application, but: "In the first manipulative field study examining the environmental impacts of floating solar, published Dec. 6 in Environmental Science & Technology, researchers found that floating solar panels increased greenhouse gas emissions on small ponds by nearly 27%. [...] "'If you put floating solar on there,' Grodsky said, 'you're drastically reducing oxygen availability for organisms, you're messing with ecological processes, how decomposition takes place, the microbes, the way wind moves across the surface of the water. It's all connected.'" This is another case which calls into question the reliability of the computer models in predicting climate outcomes. The environmental systems are still far too complex to currently be modeled with accuracy, as example after example demonstrate. |
01-27-25 | Phys.org |
—
| Back up to: |
|
Index |
|
|
||
| Next Section: |
|
Conclusions Concerning the IPCC Report |